

This topic focuses on the Analytical page of the Markov diagram control panel, which contains most of the tools you will need to analyze a Markov diagram. For more information about the control panel in general, see Control Panels.
The Analytical area displays the status and results of the analysis.
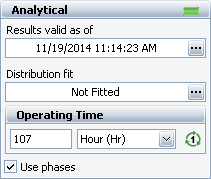
Status If the light is green, then the diagram has been analyzed. If the light is red, then the diagram has not been analyzed. An analyzed diagram will remain in the analyzed state unless a change is made to the diagram (e.g., a block is added, a transition is removed, a phase is added, etc.).
Show Results (...) displays the most recently generated analysis results in the Results Explorer.
Distribution fit is available only for continuous Markov diagrams. It displays the distribution that has been fitted to the analytical results. Click the button (...) to open the Distribution Estimator to fit a distribution and/or for on the fitted distribution parameters. The fitted distribution can be used to describe the overall behavior of the system and can be published for use as a model elsewhere in the project.
Number of Steps is available only for discrete diagrams. It allows you to specify the number of steps to be performed when analyzing the diagram. If the Use phases check box is selected below, phases will be enabled in the diagram and this value will represent the total length of the analysis (i.e., the sum of the lengths of all phases).
Operating Time is available only for continuous diagrams. It allows you to specify the length of time to be considered when analyzing the diagram. If the Use phases check box is selected below, phases will be enabled in the diagram and this value will represent the total length of the analysis.)
If nothing is selected in the diagram, the Information area displays basic information about the diagram (or the phase that is currently selected). If a block or transition is selected, it displays a subset of the properties found in the properties window.
The Tools area gives you quick access to the tools you will need to analyze the diagram and generate additional results.
![]() Analyze analyzes the
diagram.
Analyze analyzes the
diagram.
![]() Plot
creates a plot based on the analysis results. Clicking the Plot
icon before the diagram has been analyzed will automatically perform the
analysis and then plot the data.
Plot
creates a plot based on the analysis results. Clicking the Plot
icon before the diagram has been analyzed will automatically perform the
analysis and then plot the data.
![]() QCP
opens the Markov Quick Calculation
Pad (QCP). The QCP allows you to obtain metrics of interest based
on the analyzed diagram.
QCP
opens the Markov Quick Calculation
Pad (QCP). The QCP allows you to obtain metrics of interest based
on the analyzed diagram.
![]() Change Diagram Type
changes the current diagram to the opposite diagram type (i.e., changes
the current discrete diagram to a continuous diagram, or the current continuous
diagram to a discrete diagram). If you prefer to create a new diagram
using the new type, use the Change Diagram Type window (Markov
> Selection > Diagram Actions > Change Diagram Type) instead.
Change Diagram Type
changes the current diagram to the opposite diagram type (i.e., changes
the current discrete diagram to a continuous diagram, or the current continuous
diagram to a discrete diagram). If you prefer to create a new diagram
using the new type, use the Change Diagram Type window (Markov
> Selection > Diagram Actions > Change Diagram Type) instead.
© 1992-2017. HBM Prenscia Inc. ALL RIGHTS RESERVED.
 |
E-mail Link |