
After a simulation diagram, Markov diagram or RENO flowchart has been simulated, you can view the results in the Results Explorer. To access these results from the Maintainability/Availability Simulation window or the RENO Simulation window, click the Details button. To access from within any simulation diagram, click the Show Simulation Details (...) icon on the control panel or choose Simulation > Tools > Show Simulation Details.
![]()
To access the results from a Markov diagram, choose Analysis > Tools > Show Analysis Results.
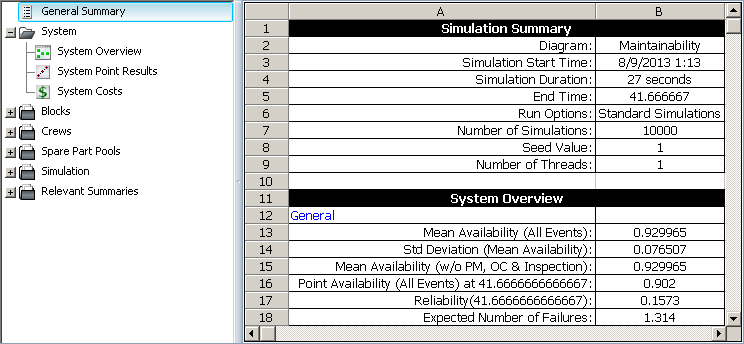
![]()
The navigation panel on the left side of the window shows which results are available from the current simulation or analysis. Click any node to display those specific results in the worksheet on the right.
Note the following:
New results replace all previous results and only the most recent results are saved with the diagram. If you wish to store the current results and then resimulate/reanalyze, you can use the Transfer Report command to send the results to a Synthesis Workbook or to Excel before you start the next analysis.
For simulation diagrams, if you selected to perform multiple simulations, some of the results (e.g., expected number of failures, etc.) will be decimals because they are averaged across all simulations. If you selected to perform one simulation, those results will be whole numbers.
Time Units:
For simulation diagrams and continuous Markov diagrams, results that are time-based (e.g., downtime, time to event, time spent in state, etc.) are given in terms of the time unit that is specified in the Unit group of the ribbon. You can select a different time unit from this drop-down list at any time and the results will automatically be converted to the new time unit.
For RENO flowcharts, all results are given in terms of the system base unit (SBU). (See Using Time Units in RENO.)
In addition to standard commands for cut, copy, paste, clear and print, the ribbon in the Results Explorer also provides the following, depending on the diagram type you are working with:
![]() Show Expanded Block Name applies only for subdiagram blocks. It displays the name of the diagram represented by a subdiagram block in the Block Name column.
Show Expanded Block Name applies only for subdiagram blocks. It displays the name of the diagram represented by a subdiagram block in the Block Name column.
![]() Show Block Description displays the description of the block, as defined in the Block Properties window.
Show Block Description displays the description of the block, as defined in the Block Properties window.
![]() Freeze Block Name Column is available only for simulation diagrams and RENO flowcharts. It freezes the Block Name column in the worksheet so that it remains visible as you scroll to the right to view additional columns. If not selected, the Block Name column may not remain visible, depending on your screen resolution and the sizing of the window.
Freeze Block Name Column is available only for simulation diagrams and RENO flowcharts. It freezes the Block Name column in the worksheet so that it remains visible as you scroll to the right to view additional columns. If not selected, the Block Name column may not remain visible, depending on your screen resolution and the sizing of the window.
![]() Set Colors opens the Set Report Colors window, which allows you to set the fill and colors for worksheet elements such as column titles, sub-headings, etc. These settings are defined separately for each diagram type, and apply to all diagrams of that type.
Set Colors opens the Set Report Colors window, which allows you to set the fill and colors for worksheet elements such as column titles, sub-headings, etc. These settings are defined separately for each diagram type, and apply to all diagrams of that type.
![]() Transfer Report allows you to send the contents of the Results Explorer to a Synthesis Workbook or to Excel. In the Transfer Report window that appears, "current item" refers to the simulation results worksheet that is currently selected, "current view" refers to all worksheets that are currently open and "full report" refers to all worksheets in the Results Explorer. If you have simulated a phase diagram, the results that are transferred for "current item" or "current phase" are based on your selection in the Phase group of the ribbon, while "full report" refers to all phases.
Transfer Report allows you to send the contents of the Results Explorer to a Synthesis Workbook or to Excel. In the Transfer Report window that appears, "current item" refers to the simulation results worksheet that is currently selected, "current view" refers to all worksheets that are currently open and "full report" refers to all worksheets in the Results Explorer. If you have simulated a phase diagram, the results that are transferred for "current item" or "current phase" are based on your selection in the Phase group of the ribbon, while "full report" refers to all phases.
![]() Full Report opens all of the currently available worksheets in separate tabs in the Results Explorer. You can then use either the navigation panel or the tabs to switch between worksheets.
Full Report opens all of the currently available worksheets in separate tabs in the Results Explorer. You can then use either the navigation panel or the tabs to switch between worksheets.
![]() Send Selection to Weibull++ is available only for simulation diagrams and RENO flowcharts. It sends the selected data to a life data folio in Weibull++. You must have Weibull++ activated on your computer in order to view the resulting folio. To use this functionality, one or two columns of data must be selected in the worksheet.
Send Selection to Weibull++ is available only for simulation diagrams and RENO flowcharts. It sends the selected data to a life data folio in Weibull++. You must have Weibull++ activated on your computer in order to view the resulting folio. To use this functionality, one or two columns of data must be selected in the worksheet.
![]() Send RDA Results to Weibull++ is available only for simulation diagrams. It transfers the data in the RDA Data worksheet to a Weibull++ parametric RDA folio within the current project. If Weibull++ is installed on your computer, you can then perform parametric recurrent event data analysis on the data set. The parametric RDA folio uses the General Renewal Process (GRP) model to analyze the failure behavior of a repairable system. The GRP analysis method takes into account the effectiveness of repairs on the condition of the system, and models the cumulative number of failures over time.
Send RDA Results to Weibull++ is available only for simulation diagrams. It transfers the data in the RDA Data worksheet to a Weibull++ parametric RDA folio within the current project. If Weibull++ is installed on your computer, you can then perform parametric recurrent event data analysis on the data set. The parametric RDA folio uses the General Renewal Process (GRP) model to analyze the failure behavior of a repairable system. The GRP analysis method takes into account the effectiveness of repairs on the condition of the system, and models the cumulative number of failures over time.
![]() Send RGA Results to RGA is available only for simulation diagrams. It transfers the data in the RGA Data worksheet to an RGA folio using the Multiple Systems - Concurrent Operating Times data type within the current project. If RGA is installed on your computer, you can then perform reliability growth analysis on the data set.
Send RGA Results to RGA is available only for simulation diagrams. It transfers the data in the RGA Data worksheet to an RGA folio using the Multiple Systems - Concurrent Operating Times data type within the current project. If RGA is installed on your computer, you can then perform reliability growth analysis on the data set.
For BlockSim diagrams only, the units drop-down list allows you to specify the time units used for the results. When you choose a new time unit, the software performs the unit conversion automatically. Authorized users can define the time units that will be available in the database and set up the conversion factors.
For phase diagrams only, the phase drop-down list allows you to select the phase that you want to view simulation results for. You can select an individual phase or select Overall to view results for all phases.
© 1992-2017. HBM Prenscia Inc. ALL RIGHTS RESERVED.
 |
E-mail Link |