
You can use the analytical results and maintainability/availability simulation results for your BlockSim diagrams and fault trees to generate Failure Reporting, Evaluating and Display (FRED) Reports. These reports provide a graphical demonstration of the reliability and maintainability/availability characteristics of the components in a system and help to identify the components that may require improvement.
To add a FRED report to the project, choose Insert > Reports and Plots > FRED Report.
![]()
In the Select Diagram window that appears, select the diagram that you want to create the report for. You can select any diagram that is currently in an analyzed state; diagrams that have not been analyzed will be displayed in the list but cannot be selected.
You can create a FRED report for any FMRA diagram that inherits its reliability from its dependents by following the steps above or by selecting/opening the diagram in the FMRA view and choosing FMRA > Calculations > FRED Report.
The FRED report will be displayed, as shown next.
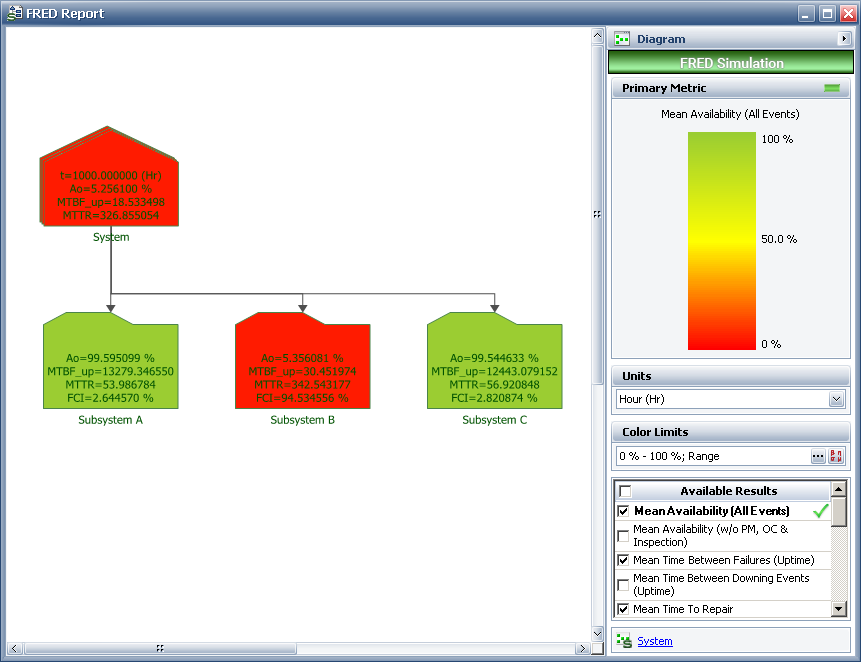
The pentagon-shaped block in the first row represents the results for the first diagram included in the FRED report. This block will always show the time at which the results are reported for the system and its blocks.
For analytical FRED reports, you can specify the result time in the At Time field on the control panel. You can also set the time units by selecting an option from the Units drop-down list. When you click Recalculate, the FRED report will update all of the blocks to show their results at the new time and/or units.
For simulation FRED reports, results are reported at the simulation end time. You can set the time units by selecting an option from the Units drop-down list. The FRED report will automatically update all of the blocks to show results based on the new units.
The boxes in the following row represent the blocks and subdiagrams in the first diagram. For any subdiagram that appears in the FRED report, you can add a row below it that shows the blocks in the subdiagram. To do this, select the subdiagram and either double-click it or choose FRED > Levels > Append Level Below.
![]()
Note: For simulation diagrams that contain subdiagrams, you must select the Report subdiagram results check box on the Analysis Settings page of the diagram control panel in order for the subdiagram results to be available for use in the FRED report. If you have not selected this check box, subdiagram blocks in the FRED report will show "N/A" instead of results. If you attempt to append a level below such a block, you will see a message that explains the problem and offers you the opportunity to resimulate the diagram with the subdiagram results reported.
You can also expand all subdiagrams in the report by choosing FRED > Levels > Auto Expand.
![]()
To remove a single row, select the subdiagram block that the row was appended to and then choose FRED > Levels > Remove Level(s) Below.
![]()
You can clear all additional rows by choosing FRED > Levels > Restart FRED Report. This clears all levels of the FRED report except the original diagram so that you can restart the report creation.
![]()
You can print the report by choosing Home > Print > Print. You can also import and export FRED reports among projects.
The FRED reports that you create in the current project will be listed under the Reports folder in the current project explorer.
New in Version 11, you can select which metrics you want to show on the blocks in the FRED report.
To include a metric in the report, select its check box in the Available Results list on the control panel.
You can change the order in which the metrics are displayed in the report by dragging the metrics up and down within the list.
Double-click a metric in the list to set it as the primary metric (indicated by a green check mark in the list). The color-coding in the FRED report will be based on this metric. The primary metric can be shown on the blocks, but it does not have to be.
Tip: You can select any number of metrics for inclusion in the report. This may cause you to need to resize the blocks so that they are big enough to contain all of the results. One easy way to do this is to select all affected blocks and choose FRED > Options > Block Style to resize all of them at once, then choose FRED > Levels > Auto Arrange to automatically adjust the diagram to accommodate the new size.
 Available metrics for analytical FRED reports:
Available metrics for simulation FRED reports:
A color scale, displayed in the report’s legend, is used to rank the blocks according to a chosen primary metric. This metric is indicated by a green check mark in the Available Results list on the control panel. You can set any result as the primary metric at any time by double-clicking the result name.
You can change the range of values represented by the color scale by choosing FRED > Options > Set Color Limits
![]()
or by clicking the (...) button on the control panel to open the Set Color Limits window and set a new lower limit and upper limit. For example, if the primary metric is reliability and you want to highlight the blocks with a reliability under a certain percentage, set the lower limit of the spectrum to that value, then refresh the plot. If Show all values in legend is selected in the Set Color Limits window, the legend will show the full range of values; if it is not selected, the legend will show only the values between the upper and lower limits that you have specified. The preview shows how the specified settings will appear in the legend.
To automatically determine a minimum/maximum for the color limits based on the blocks in the diagram, click the Calculate Color Limits icon on the control panel.
![]()
As with other diagrams, you can change the appearance of FRED reports by choosing FRED > Options > Diagram Style.
![]()
You can also change the appearance of the blocks by choosing FRED > Options > Block Style.
![]()
For information on modifying appearance settings, see Diagram Skins and Appearance Settings.
© 1992-2017. HBM Prenscia Inc. ALL RIGHTS RESERVED.
 |
E-mail Link |
