![]()
![]()
| Related Topics: | ||
![]()
If you keep track of the exact calendar dates for sales and returns, you can use the Dates of Failure format to convert your warranty claims data into failure/suspension data.
In the dates of failure format, the inputs and results are in terms of days, where 1 day = 24 hours; however, you have the option to obtain the results based on a different ratio, such as 1 day = 8 hours. The new ratio for the day unit will need to be defined at the database level.
The dates of failure format consists of three data sheets: Sales, Returns and Future Sales. The figure shown next is an example of the Sales sheet.
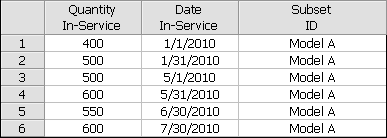
Note: For the column headings in this sheet, the general term in-service represents the closest estimate of the time at which each unit started operating in the field. For example, if you have access to both the manufacturing date and the shipping date for a group of parts, you may choose to perform the analysis based on the shipping date because it is a closer indicator of the time the product started operating in the field.
The Sales sheet contains the following information:
The Quantity In-Service column indicates the number of units that are assumed to have started operating during each period.
The Date In-Service column is for entering the calendar date on which the units are assumed to have started operating.
The Subset ID column is for logging any pertinent information or comments about the data. You can also use the Subset ID column to categorize subpopulations in your data sets. You will be able to choose a distribution appropriate for each subset of data by selecting the Use Subsets option on the Main page of the control panel.
Note: The subset ID can be any text up to 30 characters, including spaces. For example, “A _ _ X” is not the same as “A _ X” where “ _ ” is used to designate a space.
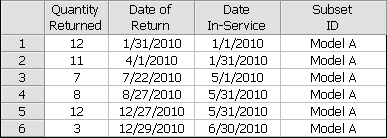
The following is an example of the Returns sheet. You will need to enter the Quantity Returned and the Date of Return. You will also need to enter the Date In-Service so the application can calculate how long each unit was in service before it was returned. Each entry in the Date In-Service column in the Returns sheet must have a matching entry in the Date In-Service column in the Sales sheet.
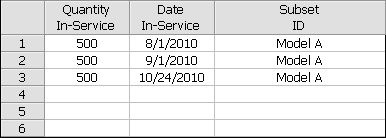
The Future Sales sheet, shown next, gives you the option to enter projected sales figures. The information in this sheet is used in the forecast analysis. Enter the number of units to be sold in the Quantity In-Service column and enter the anticipated manufacturing/sales/shipment date in the Date In-Service column.
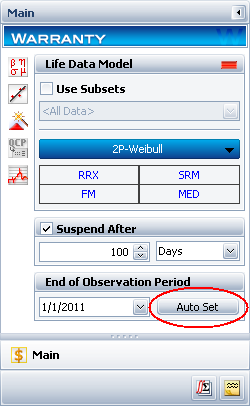
For this type of warranty analysis folio, an additional input is required in order for Weibull++ to convert the sales/return data to failures/suspensions. On the Main page of the control panel, specify the End of Observation Period. This date is typically set to the last day the warranty data was collected. It is used to determine the time in service for each unit that had not yet been returned by the end of the observation period. The time in service for a particular suspension unit is equal to the End of Observation Period date minus the Date In-Service of the unit.
To automatically set the end date to the last day the warranty data were collected, click Auto Set, as shown next. This may be the latest date that appears on the Sales sheet or the latest date that appears on the Returns sheet, whichever is more recent.
To perform the warranty analysis, go to the Main page of the warranty folio control panel and choose a failure distribution for the data set and a parameter estimation method (you can also choose the parameter estimation settings from the Analysis page of the control panel). Click Calculate. Weibull++ automatically converts the warranty data into failure/suspension times and also estimates the parameters of the chosen distribution.
To view the failures/suspension data, click anywhere within the Analysis Summary area of the control panel to open the Results window, which shows converted failure/suspension data and the parameters of the life distribution model. From the Results window, you can edit, copy or print the results.
© 1992-2015. ReliaSoft Corporation. ALL RIGHTS RESERVED.