![]()
![]()
| Related Topics: | ||
When you use the parametric binomial option of the RDT tool, you can also create a table and plot based on the target metric and life distribution that you specified on the RDT sheet. Depending on what you select to solve for, the table will display a range of test duration values as a function of sample size and number of allowable failures, or it will display a range of required sample size values as a function of test time and number of allowable failures. The table and plot provide quick ways to consider many possible test plan scenarios without having to perform each calculation individually.
Follow the steps outlined below to create the table.
Open the RDT tool and solve for required test time or sample size using the parametric binomial test design option. The table will use the target reliability and life distribution that you specified to produce its results.
Click the Show RDT Table icon (shown next) on the control panel.
![]()
The Test Design Table page will appear with an empty data sheet. In the Solve for area, select which value you wish to solve for.
Test time for given sample size solves for the test time given a range of sample sizes. When you select this option, the Sample Size Range area will require that you enter a starting sample size, an ending sample size and an increment value by which the sample will increase in the table.
Sample size for given test time solves for sample size given a range of test times. When you select this option, the Test Time Range area will require that you enter a starting test time, an ending test time and an increment value by which the test time will increase.
For either option, you must enter starting, ending and increment values for the number of allowable failures in the Number of Failures Range area. A demonstration test will fail to demonstrate the target reliability if the number of failures exceeds this number. Thus, if you are designing a zero-failure test, then the test will demonstrate the target reliability only if no failures occur.
Click Calculate to create the table.
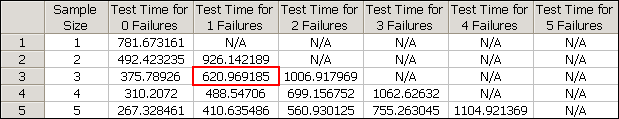
The data sheet shown next displays a parametric binomial table. For example, the second cell in the table tells us that if you used a test time of about 621 hours and no more than one failure occurred during the test, then you would need a sample size of 3 to demonstrate the target metric.
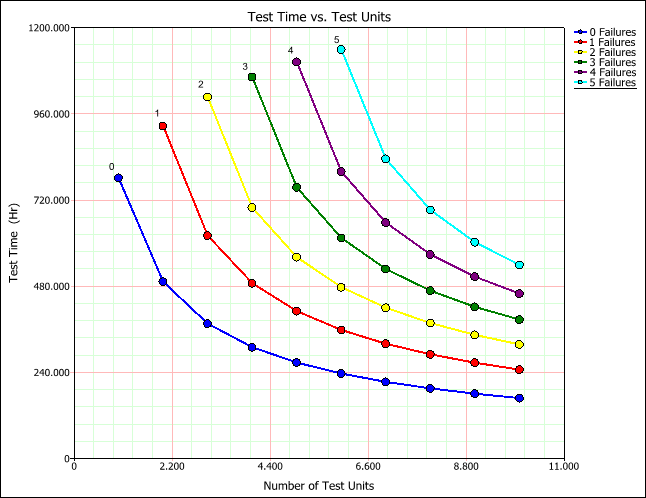
To view a plot of the table results, click Redraw Plot. Each colored line in the plot corresponds to a specific number of failures; this depicts how the allowed number of failures influences the test time and the required sample size.
© 1992-2015. ReliaSoft Corporation. ALL RIGHTS RESERVED.