![]()
![]()
![]()
Event logs, or maintenance logs, store information about a piece of equipment's failures and repairs. They provide useful information that can help companies achieve their productivity goals by giving insight about the failure modes, frequency of outages, repair duration, uptime/downtime and availability of the equipment.
Some event logs contain more information than others, but essentially event logs capture data in a format that includes the type of event, the date/time when the event occurred and the date/time when the system was restored to operation. The volume of this type of data can become very large and the task of extracting useful and concise information can also be cumbersome. To facilitate the processing of the data, the Weibull++ event log folio is designed to convert your log entries into failure/repair data and perform basic life data analysis. In addition, the folio calculates additional information such as the total uptime/downtime of the equipment and the total number of repair actions performed.
To create an event log folio, choose Insert > Folios > Event Log or right-click the Specialized Folios folder in the current project explorer and choose Add Event Log on the shortcut menu.
![]()
The following is an example of an event log folio data sheet. In this example, the events are from two cutting machine systems in two parallel production lines.
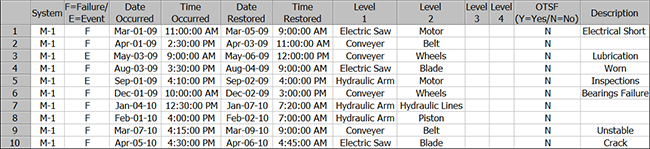
Every event log data sheet contains some or all of the following information:
The System column identifies the system that experienced an event. In the sample data sheet, the machines are identified by the labels M-1 and M-2.
The System column is optional, and it can be displayed by selecting the Use System column check box on the Other page of the folio’s control panel. If the System column is not used, all events are assumed to have occurred for the same system.
All occurrence dates in the log must be within the defined observation period for the system. You will enter the start/end dates of the observation period for the system in the System area of the control panel.
The F=Failure/E=Event column indicates whether the occurrence was a failure event (F) or a general event (E). A general event represents an activity that brings the system down but is not directly relevant to the reliability of the equipment, such as preventive maintenance, routine inspections and the like.
If you choose to include general events (E) in the analysis, you will have the option on the control panel to select whether you want to calculate the failure/repair distributions of the F and E occurrences separately or combined.
Date Occurred and Time Occurred indicate the exact date and time of the event.
Date Restored and Time Restored indicate the exact date and time the system was restored to operating mode.
Levels 1, 2, 3 and 4 indicate the subsystem or component that was responsible for the event. This gives you the flexibility to analyze the failure and repair data by certain levels within the system. For example, in row 1 of the sample data sheet, the failure event was caused by the motor of the electric saw of machine M-1. By entering this level of information in the data sheet, you will have the option to obtain individual failure and repair distributions for the motor (2nd level) and the electric saw (1st level). Note that in order to perform an analysis, you must at least specify a 1st level component for every entry in the log.
OTSF (Operates Through System Failures) allows you to specify whether the component will continue to accumulate age when any failures other than the component’s own failure occur. Enter a Y in this column to indicate that the component continues to operate through other failures or enter an N to indicate that the component is assumed to be failed when the system is failed.
Note that the entry in this column for a particular component must be consistent with all other events in the data set associated with the component. For example, there are two rows in the sample data sheet with events associated with the electric saw blade (rows 4 and 10), both of those rows must contain the same value (Y or N) in the OTSF column because the blade either does or does not continue to operate when the system fails due to another type of event.
The OTSF column is optional, and it can be displayed by selecting the Use OTSF column check box on the Other page of the folio’s control panel. If this column is not used, all components are assumed to be failed when the system is failed.
The Description column is for logging any other pertinent information or comments about the event. The information has no effect on the analysis.
After you have entered the data for your system in the data sheet, the next step is to select the settings for the analysis (see Event Log Control Panel Settings). If your system does not operate on a 24/7 basis, you may also want to define the shift schedule of the system so that you obtain accurate calculations for the failure and repair times (see Set Shift Pattern).
© 1992-2015. ReliaSoft Corporation. ALL RIGHTS RESERVED.