![]()
![]()

The Equation Fit Solver is a tool that allows you to estimate the parameters of any user-defined non-linear equation. This gives you the flexibility to perform simple parameter estimation on statistical models other than the life distributions available in Weibull++.
To add an Equation Fit Solver folio to a project, choose Insert > Tools > Equation Fit Solver or right-click the Tools folder in the current project explorer and choose Add Equation Fit Solver on the shortcut menu.
![]()
Consider a product that has the following mean life for each stress level:
| Stress Level (Temperature K) | Mean Life (Hours) |
| 393 | 6685.111904 |
| 408 | 5730.096004 |
| 423 | 4775.08002 |
The relationship between the stress level and mean life can be described by the Eyring acceleration model:
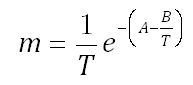
where:
m is the mean life.
T is the operating temperature (i.e., use stress level).
A and B are the parameters of the equation.
In order to estimate the mean life at any given temperature, parameters A and B must be determined. To solve for these parameters, follow the steps outlined below:
The first step is to write the Eyring acceleration model in the form y = F(x), where x is the random variable. For this example, let T = x and m = y. This results in:
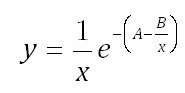
Enter the equation in the Formula field of the control panel, as shown next.
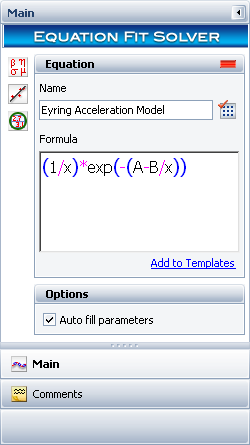
Use the Function Parameters area of the folio to provide a starting point for estimating the parameters
In the Is greater than and Is less than columns, set an estimate for the minimum and maximum values for each parameter in the equation. If the iteration does not converge at the specified range, you will need to edit the range values until a solution can be obtained. For this example, use the following values:
A is estimated to be greater than -100 and less than 1000.
B is estimated to be greater than -100 and less than 5000.
In the Initial Guess column, set a value from which the approximation for the corresponding parameter will start. If the iteration cannot arrive at a solution, you will need to edit the initial guess values until a solution can be obtained. For this example, the initial guess for A is 0.01 and the initial guess for B is 0.2.
In the Data area, enter the information from Table 1. Enter the stress level values in the X column and enter the mean life values in the Y column.
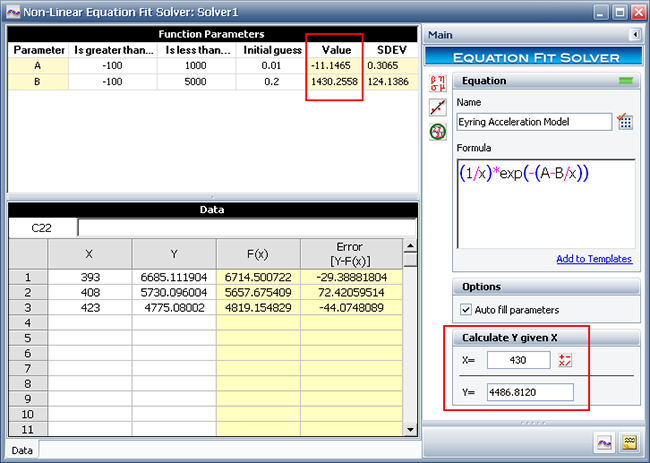
Click the Calculate icon on the control panel to solve for the parameters of the equation..
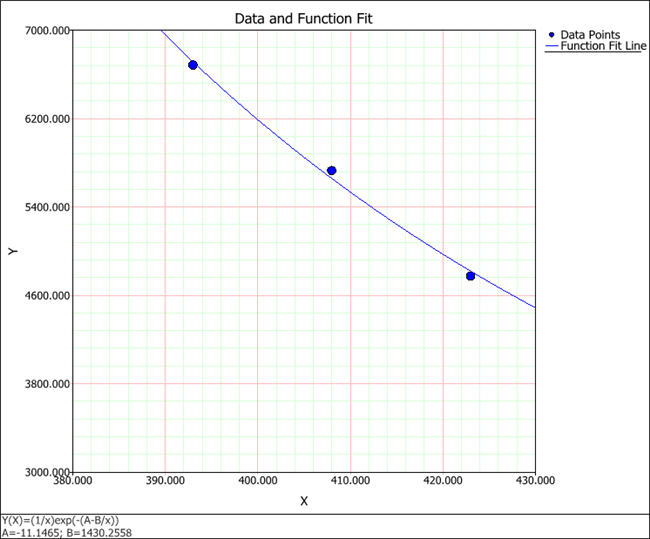
The parameter values are found to be A = -11.1465 and B = 1430.2558, as shown next. By obtaining the parameters, we can now estimate the mean life (y) for any given stress level (x) by using the Calculate Y given X tool. For example, in the picture shown next, the estimated mean life for a temperature of 430 K is 4486.81 hours.
The following columns allow you to evaluate the results of the parameter estimation:
The SDEV column shows the standard deviation of the values of the parameters, which helps you to evaluate the amount of variability in the data set.
The F(x) column shows the calculated mean life (y) at each stress level (x) when the estimated values of the parameters are substituted in the user defined equation.
The Error [Y-F(x)] column shows the calculated distance (the error) of the known value in the Y column to its corresponding value in the F(x) function. This helps you to evaluate the fit of the F(x) function to the data set.
To visually assess how well the function fits the known data points of the equation, click the Plot icon on the control panel. The Data and Function Fit plot is shown next (with the scaling adjusted).
© 1992-2015. ReliaSoft Corporation. ALL RIGHTS RESERVED.