
| Related Topics: | ||
After you build a robust parameter design, the Data tab will include a test plan. An example plan with the default columns shown is displayed next.
All of the available columns for robust parameter designs are described in more detail below. To hide/show columns, use the Visible Columns window.
Standard Order displays the basic order of runs, as specified in the design type, without randomization. This pattern is provided as a reference (e.g., textbook examples often use the standard order).
Tip: If you need to use a non-randomized order in an actual experiment, you can sort the design by clicking a cell in the column you wish to sort by and choosing Sheet > Sheet Actions > Sort > [Order]. For example, if changing levels in a randomized experiment would be too expensive, you can sort the design table by factor levels.
Run Order displays the randomized order generated by the software. By conducting experiments using a randomized order, you can reduce the effect of factors not being investigated.
Factor Columns display the settings used for each factor in the run. By default, these columns are titled using the format "X: Factor Name," where X is the abbreviated name. If you have defined the units for the factor, that will also be displayed in the column header. Factor columns are shown in green by default.
Factor levels can be displayed as the actual values assigned in the factor properties or as coded values. When you use coded values for two level factorial or Plackett-Burman designs, the low level will be displayed as -1 and the high level will be displayed as 1. When you use coded values for general full factorial or Taguchi OA factorial designs, the lowest level will be displayed as 1, the next level as 2, and so on. To switch between coded and actual values, choose Data > Display > [Value Type].
Noise Condition Columns allow you to enter the response data at different noise conditions. For more information on using these columns, see "Using Robust Parameter Designs" below.
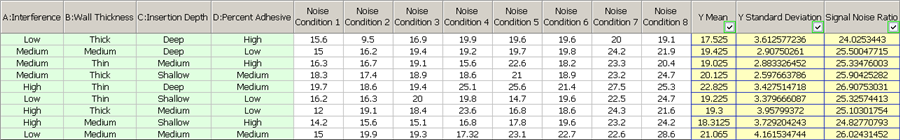
The following columns are populated by DOE++ when the data set is analyzed, using calculations based on your input in the noise condition columns. They are then used as the responses for the analysis.
Y Mean is the mean value of the response at the given control settings across all noise conditions.
Y Standard Deviation is the standard deviation of the response at the given control settings across all noise conditions. This column has the natural log transformation applied by default.
Signal Noise Ratio is a measure of the effect of the noise conditions on the response value at the given control settings; a larger signal-to-noise ratio indicates less effect of the noise conditions.
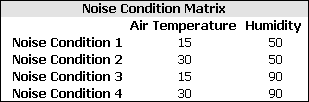
In each cell in the noise condition columns, enter the response value obtained at the control factor settings specified in the current row and at the current noise condition. The noise factor settings represented by each noise condition column are available in the Noise Condition Matrix in the Design Summary on the Design tab. For example, consider the Noise Condition Matrix and Data tab shown next.
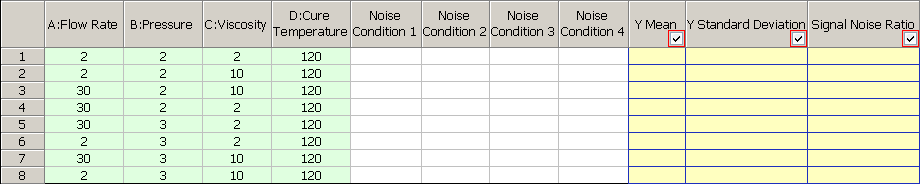
In the first row of the Data tab, you would enter the response values that were measured with the control factors set as follows:
Flow Rate: 2
Pressure: 2
Viscosity: 2
Cure Temperature: 120
In the Noise Condition 1 column, you would enter the value measured at those control factor settings when Air Temperature = 15 and Humidity = 50. In the Noise Condition 2 column, you would enter the value measured when Air Temperature = 30 and Humidity = 50, and so on.
In analyzing the data set, DOE++ can calculate results for the Y Mean, Y Standard Deviation and Signal Noise Ratio columns. You will select one or more of these columns to be used as the "responses" for the analysis by selecting the check boxes in the column headers.
Each value in the Y Mean column is the average measured response at the specified combination of control factor settings, across all noise conditions.
The Y Standard Deviation column provides the standard deviations for the Y Mean values.
The values in the Signal Noise Ratio column indicate how robust the response is to the noise factors at the specified combination of control factor settings, where a greater value indicates that the measured response is less affected by the noise factors. This is the main point of robust parameter design, so you will almost always have this column selected.
For each column selected for inclusion in the analysis, you can specify settings on the Analysis Settings page of the control panel. For the Signal Noise Ratio column, you must specify the equation to be used in calculating the ratio. Your selection for this option is determined by the purpose of your analysis:
Nominal (or "nominal-the-best") should be used if you have a specific target value for the measured response.
Larger (or "larger-the-better") should be used if you want to maximize the value of the measured response.
Smaller (or "smaller-the-better") should be used if you want to minimize the value of the measured response.
© 1992-2015. ReliaSoft Corporation. ALL RIGHTS RESERVED.