
| Related Topics: | ||
After you build an RSM reliability design, the Data tab will include a test plan with Response columns for entering response data. An example plan for a central composite reliability design with the default columns shown is displayed next.
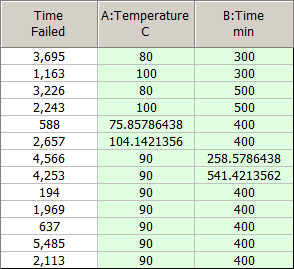
Each cell in the last column is used to record the response value obtained at the combination of factor settings (green columns) specified in the current row.
All of the available columns for central composite designs are described in more detail below. To hide/show columns, use the Visible Columns window.
Standard Order displays the basic order of runs, as specified in the design type, without randomization. This pattern is provided as a reference (e.g., textbook examples often use the standard order).
Tip: If you need to use a non-randomized order in an actual experiment, you can sort the design by clicking a cell in the column you wish to sort by and choosing Sheet > Sheet Actions > Sort > [Order]. For example, if changing levels in a randomized experiment would be too expensive, you can sort the design table by factor levels.
Run Order displays the randomized order generated by the software. By conducting experiments using a randomized order, you can reduce the effect of factors not being investigated.
Life Data Columns are present only for reliability DOE. The columns that are available depend on the type of life data specified when the design was created. These columns take the place of the response column(s) in a standard design, and are used to calculate the underlying response for the design, which is considered to be time.
Time Failed Column allows you to enter the failure time for each unit. This column is available only for times-to-failure data with no censoring (complete data).
State F or S Column allows you to specify whether the unit is failed (F) or suspended (S). This column is available only for data with right censoring.
Time to F or S Column allows you to enter the failure time for the unit or, in the case of suspended units, the time at which the unit was removed from the test while still operating. Note that you can enter a negative number in this column and it will automatically be marked as a suspension in the State F or S column. This column is available only for data with right censoring.
Last Inspected Column allows you to enter the last time the unit was inspected prior to the time it failed. This column is available only for data with interval and/or left censoring.
State End Time Column allows you to enter the time at which the unit’s state was discovered (i.e., the first inspection time after the unit’s failure). This column is available only for data with interval and/or left censoring and without right censoring.
To change the type of life data used in the experiment, use the Alter Data Type window.
Point Type indicates what kind of point the run is. 0 indicates that the run is a center point.
For central composite designs, 1 indicates that the run is a corner point and -1 indicates that it is an axial point.
For Box-Behnken designs, 1 indicates that the run is not a center point.
Block Value displays the block to which the run belongs. If the design is not blocked, all rows will display the same default value.
Factor Columns display the settings used for each factor in the run. By default, these columns are titled using the format "X: Factor Name," where X is the abbreviated name. If you have defined the units for the factor, that will also be displayed in the column header. Factor columns are shown in green by default.
Factor levels can be displayed as the actual values assigned in the factor properties or as coded values. To switch between coded and actual values, choose Data > Display > [Value Type]. The low level will be represented as "-1" and the high level will be represented as "1." The center point value will be represented as "0." For central composite designs, the axial point values will be represented as -α and α (in this case, approximately -1.414 and 1.414).
Comments allows you to enter notes or other text for each run. This information is not used in any calculations.
© 1992-2015. ReliaSoft Corporation. ALL RIGHTS RESERVED.