
| Related Topics: | ||
The data set used in this example is available in the example database installed with the software (called "doe9_examples.rsr9"). To access this database file, choose File > Help, click Open Examples Folder, then browse for the file in the DOE sub-folder.
The name of the example project is "Factorial - Plackett-Burman Design."
Plackett-Burman design is a "screening design." Such designs are traditionally used for investigating a large number of factors to see which have a significant effect on the response. In the analysis of these designs, usually only main effects are estimated.
Consider a life test of weld-repaired castings (as described in Wu, Jeff and Hamada, Michael, Experiments: Planning, Analysis, And Parameter Design Optimization, John Wiley & Sons, New York, 2000). The objective of the test is to identify the important factors that affect the life and estimate the factor levels that will improve the product life. There are seven factors under investigation. A two level full factorial design would require 27 = 128 runs, and thus would be too time-consuming and costly. Therefore, an eight-run Plackett-Burman experiment will be conducted instead.
For this example, the seven factors and associated levels are shown next:
| Name | Low Level | High Level |
| Initial Structure | As Received | Beta Treat |
| Bead Size | Small | Large |
| Pressure Treat | None | HIP |
| Heat Treat | Anneal | Solution Treat/Age |
| Cooling Rate | Slow | Rapid |
| Polish | Chemical | Mechanical |
| Final Treat | None | Peen |
The response is the logged failure time of each test unit.
The experimenters use DOE++ to create a Plackett-Burman design. Then they perform the experiment according to the design and enter the response values for further analysis. The design matrix and the response data are given in the "Cast Fatigue Experiment" folio of the example project. The following steps describe how to create this folio on your own.
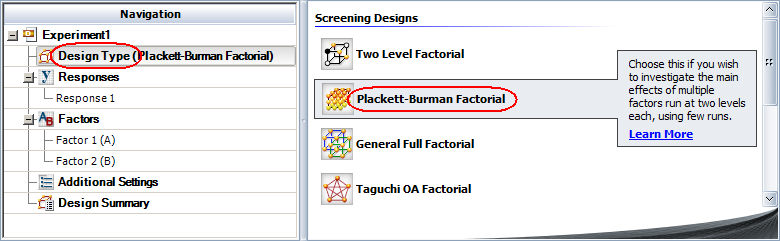
Choose Insert > DOE > Add Standard Design to add a standard design folio to the current project.
![]()
Click Design Type on the folio's navigation panel, and then select Plackett-Burman Factorial in the input panel.
Rename the response by clicking Response 1 in the navigation panel and entering Logged Failure Time in the input panel.
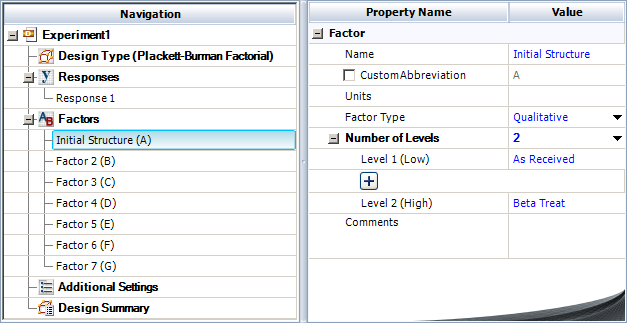
Specify the number of factors by clicking the Factors heading in the navigation panel and choosing 7 from the Number of Factors drop-down list.
Define each factor by clicking it in the navigation panel and editing its properties in the input panel. The properties are given in the table above. Note that all factors use Qualitative levels; this is specified in the Factor Type drop-down list. The first factor is defined as shown next.
Rename the folio by clicking the Experiment1 heading in the navigation panel and entering Cast Fatigue Experiment for the Name in the input panel.
Click the Additional Settings heading. On the input panel, set the number of Replicates to 1. Note that by leaving 8 selected for the Number of Runs, you are indicating that this design will use the minimum number of runs required for a Plackett-Burman design with 7 factors.
Finally, click the Build icon on the control panel to create a Data tab that allows you to view the test plan and enter response data.
![]()
The data set for this example is given in the "Cast Fatigue Experiment" folio of the example project. After you enter the data from the example folio, you can perform the analysis by doing the following:
Note: To minimize the effect of unknown nuisance factors, the run order is randomly generated when you create the design in DOE++. Therefore, if you followed these steps to create your own folio, the order of runs on the Data tab may be different from that of the folio in the example file. This can lead to different results. To ensure that you get the very same results described next, show the Standard Order column in your folio, then click a cell in that column and choose Sheet > Sheet Actions > Sort > Sort Ascending. This will make the order of runs in your folio the same as that of the example file. Then copy the response data from the example file and paste it into the Data tab of your folio.
On the Analysis Settings page of the control panel, select to use Individual Terms in the analysis.
Return to the Main page of the control panel and click the Calculate icon.
![]()
The ANOVA table and the Regression Information table for the model are available in the Analysis Summary window after you click the Detailed Summary link on the control panel.
Click the Plot icon to add the Analysis Plot tab to the folio.
![]()
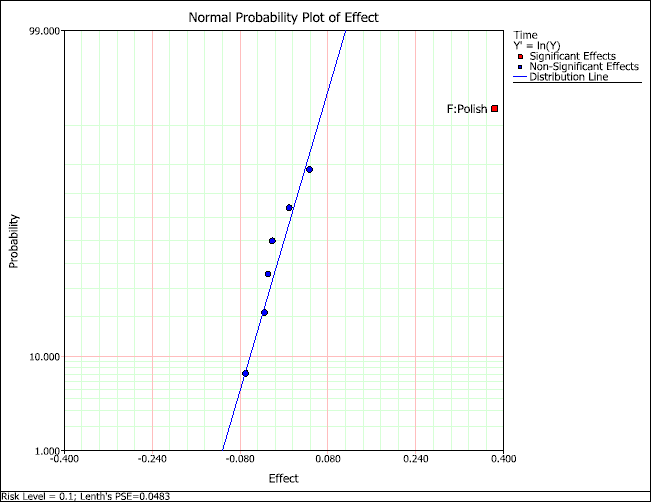
Choose the Effect Probability plot from the Plot Type drop-down list, where you can see that effect F is significant.
Click the Detailed Summary link on the control panel and select to the view the Regression Table. The effect values for each factor are contained in the table and shown next (some values were not calculated because the design does not use replicates):
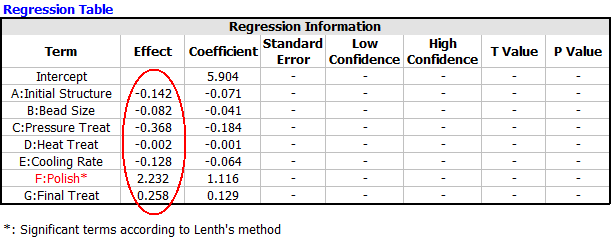
Factors A through E have negative effect values. F and G have positive effect values. Thus, assuming there are no interaction effects, a higher product life can be achieved by setting A, B, C, D and E at their low levels, and setting F and G at their high levels. If desired, further experiments can be conducted to study the interaction effects of these factors.
Moreover, since factor F's effect was great enough to be considered significant, it was found to be the most important factor.
© 1992-2015. ReliaSoft Corporation. ALL RIGHTS RESERVED.