
| Related Topics: | ||
The data set used in this example is available in the example database installed with the software (called "doe9_examples.rsr9"). To access this database file, choose File > Help, click Open Examples Folder, then browse for the file in the DOE sub-folder.
The name of the example project is "Gage Linearity and Bias Study."
In this example, a gage linearity and bias study was conducted to evaluate a gage that is used to measure the diameter of holes. The study will assess the gage's linearity, which represents its accuracy across the expected range of measurements, and its bias, which represents the difference between the gage's measurements and the actual value of the measured part. This will be done by using the gage to measure holes in an NIST standard coupon, where the true diameter of each hole is known. If the gage is found to be unacceptable, a new gage will be evaluated.
The data set or the study is given below and has been entered in the example folio. The first thirteen rows of the data sheet are shown next.
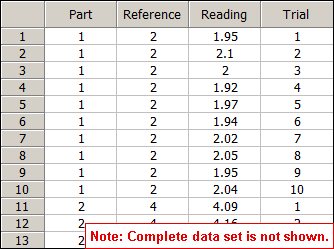
In the first row, you can see that the first part (Part 1) has an actual value of 2, and the first measurement of the part was 1.95. The Trial column (which is not used in the calculations) was used to keep track of how many times each part was measured, and in this case you can see that Part 1 was measured a total of 10 times. If you examine all the data points in the example project, you will see that a total of five parts were measured, and some were measured fewer than 10 times. To avoid any variation in measurement that could be due to different operators, all measurements in this study were performed by the same operator.
On the Analysis Settings page of the control panel, you can see that a risk level of 0.1 (10%) will be used to determine whether there is a statistically significant bias or linearity in the gage. In addition, you can see that a process standard deviation of 1 was specified.
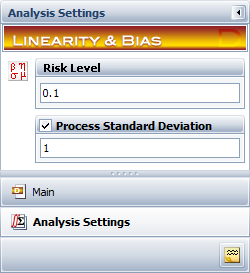
To analyze the data, click the Calculate icon.
![]()
The following summary of results will appear on the control panel.
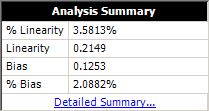
% Linearity is the percentage of increase of the process variation due to gage linearity. In this example, the observed variation in measurements will be 3.5813% greater than the variation of the parts themselves (i.e., the "true" process variation). Because this is a relatively small value, linearity is not considered a problem for this gage.
Linearity represents the variation of the measurements due to the gage linearity. To calculate this value, you must specify the process standard deviation on the Analysis Settings page of the control panel.
Bias is the difference between the "true" value of a measured part and the observed average. A positive bias means the gage overestimates. A negative bias means the gage underestimates.
% Bias is the ratio of the bias to the process variation. To calculate this value, you must specify the process standard deviation. The lower the % Bias, the better the gage. In this case, the % Bias is 2.0882%, which is also small enough to consider the bias acceptable.
The bias values for each reference and the overall study can be seen by clicking the Detailed Summary link on the control panel. The results of the bias analysis are shown next.
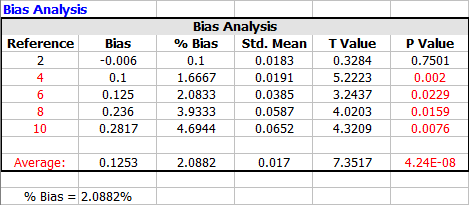
The p values show that some of the biases are significant when compared to the variation of the measured standard coupon. This is understandable since the variation of the standard coupon is usually very small. However, when compared to process variation, the average bias of this gage (i.e., average % bias) is still relatively small, so the gage is considered acceptable.
© 1992-2015. ReliaSoft Corporation. ALL RIGHTS RESERVED.