
New in Version 11, a profile is a Synthesis resource that allows you to represent a value that varies with time. It consists of a basic pattern that either repeats as a cycle or occurs once and then continues from its last defined setting.
What’s Changed? The profile resource replaces the stress profile functionality that was available in previous versions of ALTA PRO.
This topic describes how to create profiles, which can be defined by entering values manually or by importing data from nCode GlyphWorks.
To learn how to use profiles in ALTA life-stress data folios, see Time-Dependent Stress Profiles in the ALTA documentation.
Like any other Synthesis resource, you can create or edit profiles from the Resource Manager, and while you’re performing a relevant analysis. To create a profile:
Define a pattern for how a stress level will change over a specified period of time. The pattern you will define consists of a series of segments, where each segment has a specified duration and either:
a constant stress value, or
a function that takes a time value and returns a stress value.
These segments are defined in the spreadsheet, as shown next.
Segment Start is calculated automatically by the software and cannot be entered manually. The first segment's start time is always 0. For every subsequent segment, the start time is identical to the prior segment's end time.
Segment End allows you to enter the end time for each segment, which must be smaller than the end time of the next segment.
Stress S(t) is the stress value or function for the segment. If the stress level will stay constant during a segment, enter a constant value (e.g., 30). If the level will change during a segment, enter the value as a function of time (e.g., at time = 20, the function t + 20 will return a value of 40). When entering a function, you must use t or T as the time variable.
Tip: Because stress units (e.g., volts) and time units (e.g., hours) are not defined in the profile, it is important to apply profiles only to folios that are intended to use the same stress and time units. In the Profile window, you may want to rename column headings (by right-clicking the heading) or use the Comments page as a reminder of which units are applicable to that profile.
For example, suppose the stress unit is psi and the time unit is seconds. Now suppose you wanted to define the following 120-second pattern: a stress value of 30 psi for 60 seconds, followed by a stress value of 50 psi for 30 seconds, followed by a stress function that begins at 50 psi and gradually decreases at a rate of 1 psi per second for the remainder of the pattern. For this pattern, you could fill out the spreadsheet as follows:
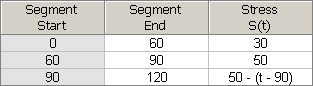
Notice that the last segment of this profile uses a stress function. Since t is the test time (or, if the profile is cyclical, the time since the pattern was last restarted), t = 90 when the last segment begins. So the last segment’s stress level starts at 50 - (90 - 90) = 50. Then, at 91 seconds, the stress level will have dropped to 50 - (91 - 90) = 49. After another second it will have dropped to 50 - (92 - 90) = 48, and so on.
Next, choose the appropriate option in the After Last Segment area of the control panel. Your selection here will determine what happens after the end time of the profile’s last segment (in the above example, after time = 120).
If you select Continue with last value, all times after the last segment will use the value/function defined in the last segment.
If you select Repeat cycle, the entire pattern of segments will be treated as a repeating cycle.
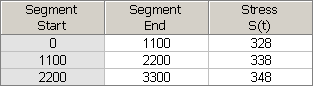
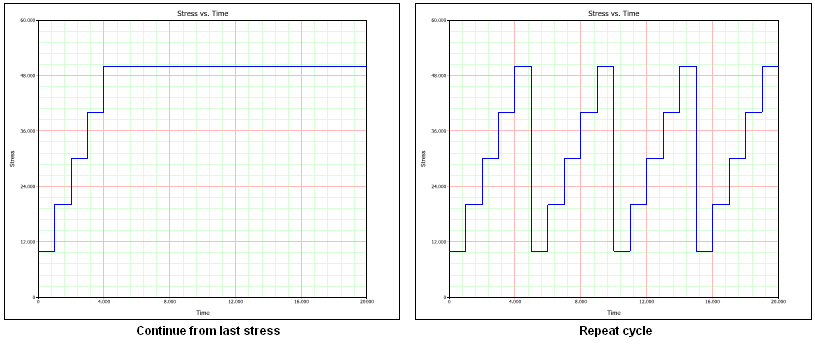
For example, suppose you defined a pattern that is made up of five segments, each an hour long and increasing stepwise from the segment before. The graphs below illustrate the difference between continuing from the last stress (left) and selecting to repeat (right). In this example, the test has a duration of 20 hours, and the graphs explain what would happen through the entire duration of the test.
Before you can use the new profile in your analysis, you must save any changes you have made and validate the current profile settings. To do this, click the Validate Profile icon.
![]()
After you save the changes in your profile, the Profile Summary area will appear. Click the Detailed Summary icon ![]() to open the Results window, which shows the current profile in a worksheet that you can copy or print.
to open the Results window, which shows the current profile in a worksheet that you can copy or print.
To view a stress vs. time plot of the profile, click the Plot icon. (See Synthesis Plot Utilities for general information on plots.)
![]()
Note: Clicking the Validate Profile icon will not automatically update your stress vs. time plot. To make sure your plot reflects the most recent profile information, click the Plot icon.
If desired, you can use the Comments page of the control panel to enter notes or other text that will be saved with the profile.
New in Version 11, you can import nCode GlyphWorks time series data from .S3T files for use as stress profiles. The stress values in the .S3T file must be greater than zero in order for the data to be imported.
To import data from an nCode .S3T file, first create a new profile from the Resource Manager (Project > Synthesis > Resource Manager). In the Profile window, click the Import from GlyphWorks icon on the control panel.
![]()
This launches the import wizard, which guides you through the steps required to import data from the file. You can then edit the resulting imported data, if desired. Note that If you update the .S3T file in GlyphWorks, the associated profile in ALTA will not be updated automatically. You must re-import the data to reflect the changes.
Tip: Because stress and time units are not defined in the profile, it is important to apply profiles only to folios that are intended to use the same stress and time units. In the Profile window, you may want to rename column headings (by right-clicking the heading) or use the Comments page as a reminder of which units were used by the data imported from the nCode file.
© 1992-2017. HBM Prenscia Inc. ALL RIGHTS RESERVED.
 |
E-mail Link |