![]()
![]()
| Related Topics: | ||
![]()
In the usage format, the analysis is based on the amount of usage the unit accumulated rather than the amount of time the unit was in the field. There are many applications where usage, not time, affects a product’s reliability. In the automotive industry, for example, the majority of failure behavior is based on mileage rather than product age. This approach could also be used in other situations, such as the number of pages for a printer, number of cycles for a washing machine, etc.
This topic describes how to enter data in the usage format. For an example of an analysis, see Example of a Usage Format Warranty Analysis.
In the usage format, you can use any usage units (e.g., miles, cycles, etc.) appropriate for your data by clicking the Change Units icon on the Main page of the folio's control panel.
![]()
This opens the Change Units window, which gives you a selection of units to use. The units that are available in the drop-down list are defined at the database level. Note that in the usage format, selecting a new unit only changes the name of the unit. The data set is not converted to the new unit. The appropriate columns in the data sheet will be automatically configured for the time units you selected, and the new unit will be displayed next to the results in the control panel.
The usage format consists of three data sheets: Sales, Returns and Future Sales. The figure shown next is an example of the Sales sheet.

The Sales sheet contains the following information:
Note: For the column headings in this sheet, the general term in-service represents the closest estimate of the time at which each unit started operating in the field. For example, if you have access to both the manufacturing date and the shipping date for a group of parts, you may choose to perform the analysis based on the shipping date because it is a closer indicator of the time the product started operating in the field.
The Quantity In-Service column is for entering the number of units that are assumed to have started operating during each period.
The Date In-Service column is for entering the calendar date on which the units are assumed to have started operating.
The Subset ID column is for logging any pertinent information or comments about the data. You can also use the Subset ID column to categorize subpopulations in your data sets. You will be able to choose a distribution appropriate for each subset of data by selecting the Use Subsets option on the Main page of the control panel.
Note: The subset ID can be any text up to 30 characters, including spaces. For example, “A _ _ X” is not the same as “A _ X” where “ _ ” is used to designate a space.
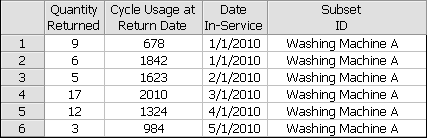
The following is an example of the Returns sheet, where the usage unit is in terms of cycles. You will need to enter the Quantity Returned and the Usage at Return Date. You will also need to enter the Date-In-Service so the application can calculate how long each unit was in service before it was returned. Each entry in the Date In-Service column in the Returns sheet must have a matching entry in the Date In-Service column in the Sales sheet.
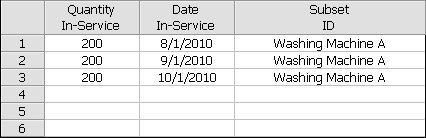
The Future Sales sheet, shown next, gives you the option to enter projected sales figures. The information in this sheet is used in the forecast analysis. Enter the number of units to be sold in the Quantity In-Service column and enter the anticipated manufacturing/sales/shipment date in the Date In-Service column.
For this type of warranty analysis folio, two additional inputs are required in order for Weibull++ to convert the sales/returns data to failures/suspensions:
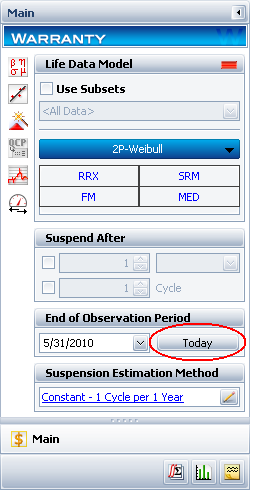
On the Main page of the control panel, specify the End of Observation Period date. This date is typically set to the last day the warranty data was collected. It is used to determine the time in service for each unit that had not yet been returned by the end of the observation period (i.e., the suspensions). Click Today if you wish to set the end date to the current date, as shown next.
The next step is to specify how Weibull++ will estimate the amount of usage for units still in the field (suspensions). To view or change the settings, click the link in the Suspension Estimation Method area of the Main page or click the Suspensions page icon at the bottom of the control panel.
![]()
To learn how to specify the suspension estimation method, see Estimating Usage.
After you have entered the warranty data and specified the suspension estimation method, perform the warranty analysis by going to the Main page of the warranty folio control panel and choosing a failure distribution for the data set and a parameter estimation method (you can also choose the parameter estimation settings from the Analysis page of the control panel). Click Calculate. Weibull++ automatically converts the warranty data into failure/suspension times and also estimates the parameters of the chosen distribution.
To view the failures/suspension data, click anywhere within the Analysis Summary area of the control panel to open the Results window, which shows the converted failure/suspension data and the parameters of the life distribution model. From the Results window, you can edit, copy or print the results.
© 1992-2013. ReliaSoft Corporation. ALL RIGHTS RESERVED.