
Available in Weibull++, ALTA and RGA, side-by-side plots give you the ability to display different plots for a single data set all in a single window for easy comparison.
To add a side-by-side plot to a project, choose Home > Insert > Side-by-Side Plot.
![]()
In the window that appears, select the analysis/data sheet you want to plot and click OK to create the plot sheet.
To view a single plot in greater detail, double-click the plot. You can double-click the plot again to return to the side-by-side view.
The control panel provides options for selecting the type of plots to display. For most analyses, the Vary area will be available, which contains two options:
The vary Plot Types option allows you to create different plots for the same data set. For example, you might wish to display both the Reliability vs. Time plot and the Failure Rate vs. Time plot of the data set.
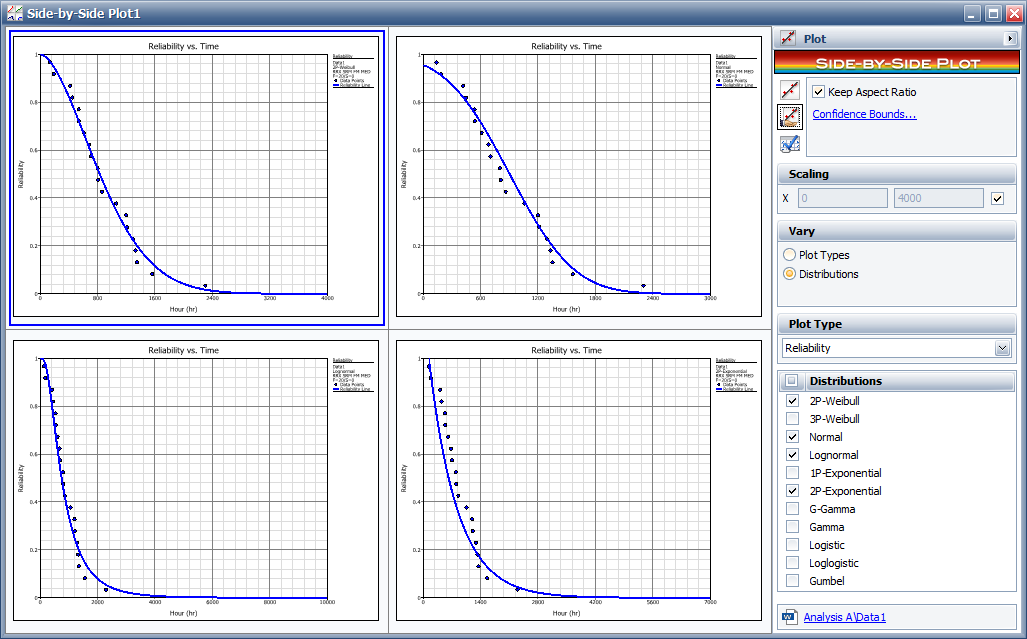
The vary Distributions or Models option allows you to compare how different distributions or models fit a particular data set. For example, you might wish to display a reliability plot for different life distributions, as shown next.
© 1992-2019. HBM Prenscia Inc. ALL RIGHTS RESERVED.
| E-mail Link |