

Ten identical units of a prototype device were reliability tested at the same application and operation stress levels. Six of the units failed during testing after operating for the following times: 16, 34, 53, 75, 93, 120 hours. Four other units were still operating after 120 hours.
The objective is to obtain the reliability of the prototype device at 60 hours, at the lower 1-sided 90% confidence bound.
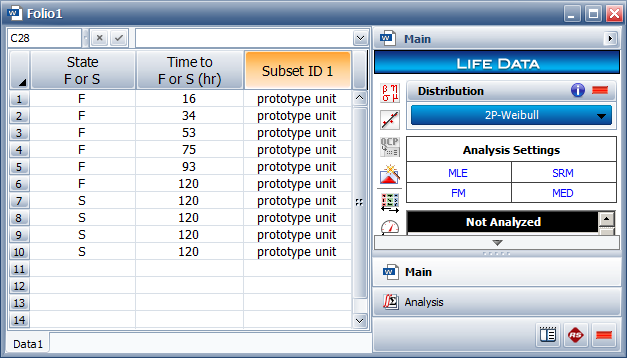
Choose Home > Insert > Life Data. In the setup window, select Times-to-failure data for the data type and then select My data sheet contains suspensions (right censored data). For the time units, select Hour. Click OK to create the folio.
Enter the given data in the data sheet, and then on the Main page of the control panel, choose the 2P-Weibull distribution and the MLE parameter estimation method, as shown next. (You may also choose the parameter estimation method on the Analysis page of the control panel.)
Choose Life Data > Analysis > Calculate or click the icon on the Main page of the control panel.
![]()
The parameters of the distribution will be automatically computed and displayed in the Analysis Summary area of the control panel. The parameters are beta = 1.5070 and eta = 128.6414.
To estimate the reliability of the device, open the QCP by choosing Life Data > Analysis > Quick Calculation Pad or by clicking the icon on the Main page of the control panel.
![]()
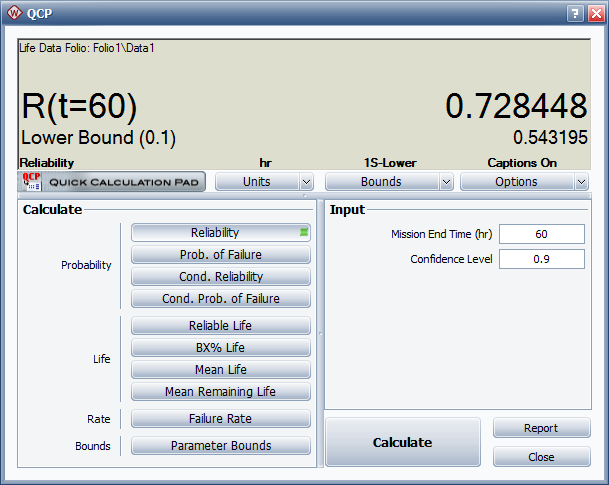
In the QCP, choose to calculate the Reliability with lower 1-sided confidence bounds. Select Hour for the time units and then make the following inputs:
Mission End Time = 60
Confidence Level = 0.9
Click Calculate to obtain the results, as shown next. The result shows that the reliability of the prototype device at 60 hours is 72.84%. The lower one-sided 90% confidence bound is estimated to be 54.32%. This means that there is 90% probability that the reliability of the device will be at least 54.32% at the end of 60 hours of operation.
To visualize the reliability of the device over time, close the QCP and then create a plot by choosing Life Data > Analysis > Plot, or by clicking the icon on the Main page of the control panel.
![]()
Show the confidence bounds on the plot by choosing Plots > Confidence Bounds > Confidence Bounds or by right-clicking the plot sheet and then choosing Confidence Bounds on the shortcut menu. In the Confidence Bounds Setup window, make the following selections:
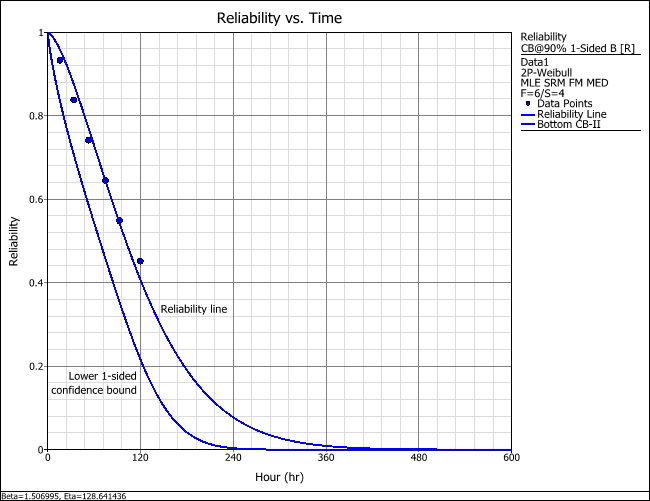
Sides: One-Sided; Show Bottom
Type: Reliability (Type II)
Confidence Level %: 90
Click OK. On the control panel of the plot sheet, choose the Reliability vs. Time plot type. The following picture shows the resulting plot (with annotations added). As you can see, the line representing the confidence bound is fairly far from the reliability line, indicating a significant amount of uncertainty in the results. Based on this result, you may choose to perform further analysis on the data, such as testing those 4 suspended units to failure to see whether the uncertainty is due to the small number of failures in the data set or due to the variability inherent in the device itself.
© 1992-2019. HBM Prenscia Inc. ALL RIGHTS RESERVED.
| E-mail Link |