
In Weibull++, there are two types of life data: times-to-failure data and free-form data. In addition, times-to-failure data may contain three forms of censoring: suspensions, interval censored or left censored data.
In a Weibull++ life data folio, the data type you select determines the data entry columns that appear in the data sheet. The following sections describe each data type and demonstrate how to enter data in a Weibull++ life data folio data sheet.
Tip: You can change the data entry columns for an existing Weibull++ data sheet anytime by choosing Life Data > Format and View > Alter Data Type.
Times-to-failure data sets, also known as complete data, are obtained by recording the exact times when the units failed. For example, if we tested five units and they all failed, and we recorded the time when each failure occurred, we would then have complete information as to the time of each failure in the sample.
To use this data type, select the Times-to-failure data check box on the setup window. Your data sheet will have a Time Failed column for recording the times-to-failure. The example shown next displays a life data folio data sheet where all the units in the sample failed. The exact time of each failure is recorded.
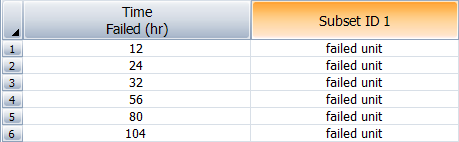
Note: In this example and in the rest that follow, the Subset ID column is used for explanatory purposes and is not intended to demonstrate how the column would normally be used.
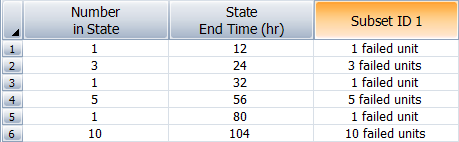
If multiple units failed at the same time, you can choose to enter the data in groups. To do this, select the I want to enter data in groups check box in the setup window. This adds a third column to the data sheet, as shown next. In this example, the units that failed at the same time are grouped together. The Number in State column indicates the number of failed units in that group (the software will automatically enter a 1 if you leave this cell blank) and the State End Time column indicates the exact time the units in each group failed.
The term suspension describes the units that did not fail during the observation period. Such units are also known as right censored data. For example, if we tested five units and only three had failed by the end of the test, the observed operating time of the two units that did not fail would be referred to as right censored data. The term right censored means that the event of interest (i.e., the time-to-failure) is to the right of our data point on the time scale.
To use this data type, select the Times-to-failure data check box and the My data contains suspensions (right censored data) check box in the setup window. Your data sheet will have a State F or S column for recording whether the data point is a failure (F) or suspension (S). In the example shown next, a test was conducted and the first five units in the sample failed but the sixth unit was still operational when the test terminated at 190 hours.
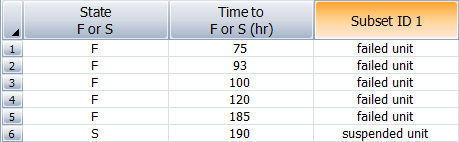
Tip: If you enter the time as a negative number (e.g., -190), Weibull++ will automatically assign it as a suspension. This time-saving feature applies only to data sheets that have been configured to support right censored data.
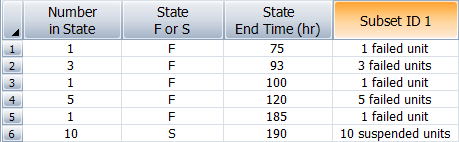
When entering this type of data in groups, units that have the same state (i.e., failed or suspended) and have the same value in the State End Time column can be grouped together, as shown next.
The term interval censored data describes the uncertainty as to the exact time the unit failed within an interval. This type of data frequently comes from tests or situations where the units are not constantly monitored. For example, if we are running a test on five units and inspecting them every 100 hours, we only know that a unit failed or did not fail between inspections. Specifically, if we inspect a certain unit at 100 hours and find it operating, and then perform another inspection at 200 hours to find that the unit is no longer operating, then the only information we have is that the unit failed at some point in the interval between 100 and 200 hours.
Left censored data is a special case of interval censored data. In left censored data, the interval is between time = 0 and some inspection time.
To use this data type, select the Times-to-failure data check box and the My data set contains interval and/or left censored data check box in the setup window. In the example shown next, the first unit was observed at 150 hours and found to be failed. The second unit was still operating at 150 hours but failed at some point prior to the next observation at 300 hours, and so on.
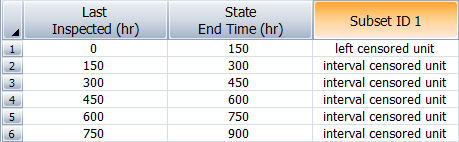
Note: Although this example shows a scenario in which the inspections occur at regularly scheduled intervals, Weibull++ does not require the start time of the interval to be equal to the end time of the previous interval.
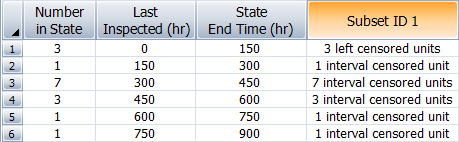
When entering this type of data in groups, all units that failed within the same interval are considered to be part of the same group.
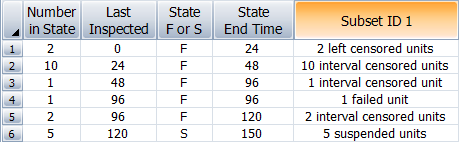
Times-to-failure data with different types of censoring can be added to a single data sheet. The data may be entered in groups or ungrouped. The following is an example of a grouped data set with complete, suspended, interval and left censored data.
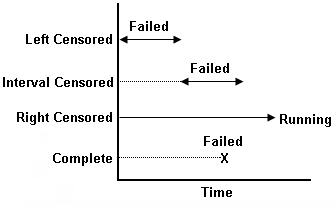
The next illustration summarizes the differences between complete data and the different types of censored data.
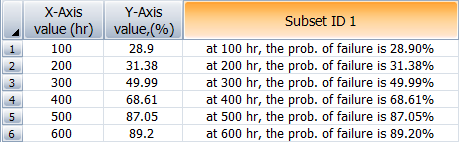
The free-form data type is used to analyze the relationship between an independent variable (x-axis data) and the percentage of failures (y-axis data) in response to the variable. The y-axis data are treated as probability units, or probits, and they show how the percentage of failures increase in response to a variable (e.g., time, distance, stress level, etc.). For example, you could use the free-form data type to record the Y percentage of automobiles that will need repair after X number of miles, or record the Y percentage of product failures at X degrees of temperature.
To use this data type, select the Free-form (probit) data check box in the setup window. In the data sheet, enter the values for the independent variable in the X-Axis value column and enter the cumulative percentage of failures in the Y-Axis value column. The following is an example of a data set that shows the effect of time (x-axis data) on the probability of failure (y-axis data) of a product.
© 1992-2019. HBM Prenscia Inc. ALL RIGHTS RESERVED.
| E-mail Link |