
This topic describes some basic features and capabilities that are available in most built-in plot utilities in ReliaSoft desktop applications (i.e., utilities where the types of plots available are predefined based on the analysis method and type of data you are working with). For information about creating your own custom charts in Synthesis Workbooks or Synthesis Dashboards, see Custom Charts or Dashboard Layout Designer.
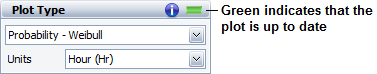
A plot needs to be refreshed whenever its data source has been recalculated or when its inputs or settings have been modified. This ensures that the plot reflects the most current results. In most plot sheets, the control panel displays a status light that indicates whether the plot needs to be refreshed. A green light indicates that the data and the plot are in sync, while a red light indicates that the plot is out of sync with the latest analysis.
You can manually update a plot to reflect any changes by clicking the Redraw Plot icon in the plot’s control panel.
![]()
Alternatively, a plot can be refreshed automatically whenever changes have been made by selecting the Auto Refresh check box on the plot’s control panel.
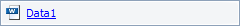
For most plots, the control panel displays a blue link that displays the plot’s source analysis, as shown in the following example for a Weibull++ plot. You can click the link to open the folio and view the data set.
In some specialty plots (side-by-side plot, life comparison tool, etc.), you can select the source analysis for the plot by clicking the icon on the plot’s control panel or ribbon.
![]()
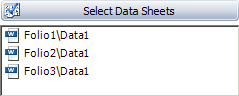
If the plot contains results from more than one analysis (e.g., overlay plots), the control panel includes a button that allows you to add or remove analyses from the plot, as shown in the example below for Weibull++ data sheets. In addition, you can click and drag the data sheets to the desired order.
When applicable, a plot may provide options for showing or hiding certain plot items such as data points, lines, probability scales, etc. The available options depend on the plot type and analysis. To view the options for the plot you are working with, choose Plot > Actions > Show/Hide Plot Items or right-click the plot and choose Show/Hide Items on the shortcut menu.
![]()
Select the check box for each item you want to appear in the plot, or clear the item’s check box to hide the item from view.
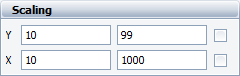
When applicable, the plot control panel may display X and Y scaling boxes that show the minimum and maximum values for the x- and y-axes. You can clear the check boxes and click inside the fields to manually edit the values, or select the check boxes to have the application choose the appropriate values for the range, based on the data.
The zoom function is available for plots that allow both X and Y scales to be adjusted. To zoom in or out of a plot, click inside the plot, point the mouse pointer over the area of interest, and then rotate the mouse wheel. Press ESC to return to the original scale.
For non-3D plots, you can also select a specific area to zoom in by holding the CTRL + SHIFT keys while clicking and dragging the mouse over the desired area. You can customize the color and line style of the zoom rectangle via the Zoom page of the Plot Setup.
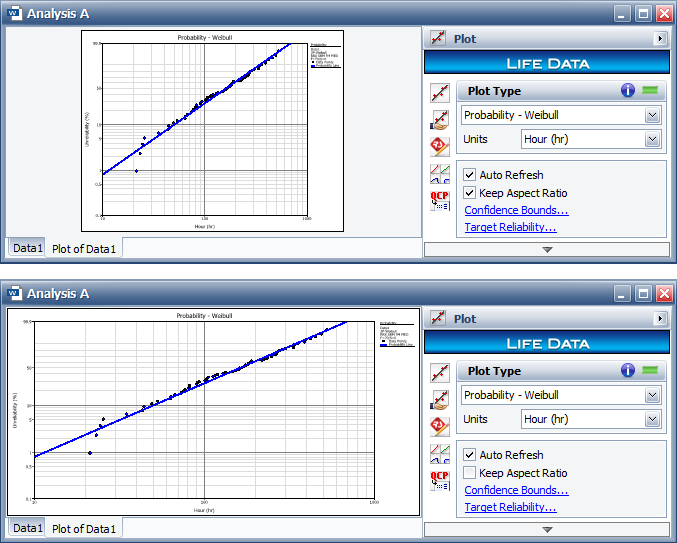
Plots are automatically resized whenever you resize the plot sheets. To maintain the proportional relationship between the width and height of the plot image, select the Keep Aspect Ratio check box on the plot’s control panel (as shown in the first example below). Clear the check box if you wish to stretch the dimensions of the plot graphic to fill the plot sheet (as shown in the second example below).
To show the coordinates for a location on a plot, press SHIFT and click the plot (no need to hold down the mouse button). To stop showing the coordinates and return the pointer to its normal mode, click the plot again.
To track the coordinates on a plot line, click the line. A crosshair shows the current location on the line. The crosshair will stay on the line and track the coordinates as you move the pointer.
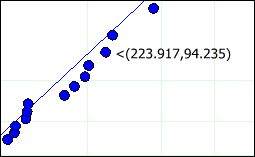
When applicable, you can add a label that displays the coordinates of a location by pressing CTRL + ALT and then clicking the location you want labeled.
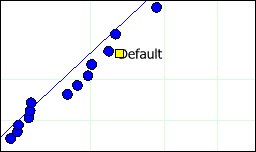
When applicable, you can add a custom label to a plot by pressing CTRL and then clicking the plot. A label named "Default" will appear in the plot. Select the label to edit the text directly in the plot or double-click it to open the Edit Label window, which gives you the option to select a font style or format.
You can then move the label by clicking it and dragging its yellow handle to the desired location on the plot. (For more extensive annotations, see ReliaSoft Draw.)
If your plot has lines or points that are obscuring one or the other, you can move an item by pressing ALT and clicking the item. The Move Plot Item window will appear, giving you the option to move the selected item either to the front or back of the obscuring graphic.
You can save a plot graphic as a *.wmf, *.png, *.gif, or *.jpg file for use in other applications by clicking the Export Plot Graphic icon on the plot's control panel, or by choosing [Plot/3D Plot] > Actions > Export Plot Graphic if applicable.
![]()
In addition, you can save a plot graphic to the Clipboard by clicking the Copy Plot Graphic icon on the plot's control panel or by choosing [Plot/3D Plot] > Actions > Copy Plot Graphic if applicable.
![]()
When saving a 3D plot graphic to the Clipboard, the image will be in *.bmp format. For all other types of plots there are three choices: If you will be pasting copied plots into any one of the spreadsheets built in to ReliaSoft desktop applications (e.g., Synthesis Workbooks or General Spreadsheets), choose Metafile Optimized for Synthesis Spreadsheet. If you will be pasting them into external applications, choose Bitmap or Metafile Optimized for External Use.
You can export the data from a plot to the Clipboard so that you can paste it into another application. The information depends on the plot type and on the application you are using.
In Weibull++, ALTA, RGA, BlockSim or RENO, choose Plot > Actions > Copy Plot Data.
![]()
In XFMEA, RCM++, RBI or Lambda Predict, click the Copy Plot Data icon on the plot's control panel.
![]()
© 1992-2019. HBM Prenscia Inc. ALL RIGHTS RESERVED.
| E-mail Link |