
Available in Weibull++, ALTA and for two-way sensitivity analysis in RENO, 3D plots give you the ability to graph functions with three variables, such as the reliability at a given time and stress level. In addition, Weibull++ and ALTA offer the option to create 3D overlay plots, which are similar to regular overlay plots but displayed in 3D space.
Before creating a plot, you must first analyze the data sets (or in RENO, you must first run the simulation for the two-way sensitivity analysis).
To add 3D plots to a project, right-click the Multiplots folder in the current project explorer and choose the type of plot:
![]() 3D Plot
3D Plot
![]() 3D Overlay Plot (Weibull++ and ALTA only)
3D Overlay Plot (Weibull++ and ALTA only)
In both cases, the plots are automatically saved and stored in the Multiplots heading in the current project explorer.
The control panel in the 3D plot folio contains basic settings for defining the X, Y and Z axes. (For advanced customization options, see 3D Plot Setup.)
The Begin and End fields, as shown next, display the minimum and maximum values for the axes. You can click inside these fields to manually edit the values, or select the Autoscale check box to have the application automatically choose the appropriate values for the range.
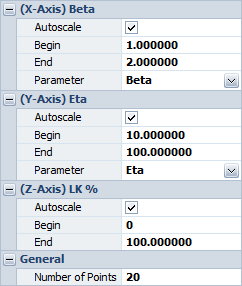
Whenever applicable, the Parameter fields will be displayed, as shown in the example above. Click these fields to change which parameter lies on which axis. The name of the parameter associated with the axis will be displayed next to that axis’s label.
© 1992-2019. HBM Prenscia Inc. ALL RIGHTS RESERVED.
| E-mail Link |