![]()
![]()
|
|
||
![]()
Non-parametric life data analysis (LDA) allows you to analyze data sets without assuming an underlying life distribution. This technique is useful when dealing with unknown failure modes, when there is not enough data to assume a life distribution or when the data set does not fit any life distribution in a satisfactory way. Non-parametric methods can give the “big picture” of how products are behaving without the level of technical detail that standard (parametric) life data analysis provides, and without the risk of errors brought about by making incorrect assumptions about the distribution; however, the non-parametric analysis does not provide reliability predictions outside of the points of observation (e.g., if failures occurred at 100 and 200 hours, the analysis will calculate the reliability at those two times, but it cannot be used to calculate the reliability at 150 hours).
In cases where you might want to estimate (i.e., interpolate) the reliability of a product between the points of observation, the non-parametric LDA folio gives you the ability to create a parametric model that is based on the analysis. This means that you convert the reliability values obtained by the non-parametric analysis into unreliability values, and then fit a distribution to the free-form data set (x = time and y = unreliability). The parametric analysis allows you to interpolate (and to some extent, extrapolate) the life characteristics of the product using the Quick Calculation Pad and a wider variety of plots.
To create a non-parametric LDA folio, choose Insert > Life Data > Non-Parametric LDA or right-click the Life Data folder in the current project explorer and choose Add Non-Parametric LDA on the shortcut menu.
![]()
Once the folio is created, select a non-parametric analysis method from the Data Type area of the control panel. The method you select will determine the columns that appear in the data sheet.
There are three non-parametric analysis methods available: Kaplan-Meier, Actuarial-Simple and Actuarial-Standard. In general, the Kaplan-Meier method is recommended for data sets with few suspensions, while the Actuarial-Standard and Actuarial-Simple methods are best for cases where the data set is mostly suspensions or when working with interval data, provided that none of the intervals are overlapping. There are no significant differences in the results between the two actuarial methods; however, in some cases, the approximation method of the Actuarial-Simple analysis may provide more conservative estimates. The ReliaWiki resource portal has more information on these analysis methods at: http://www.reliawiki.org/index.php/Non-Parametric Life Data Analysis.
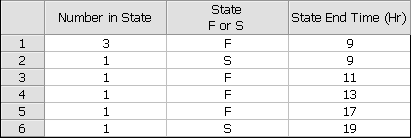
The following example shows the data sheet for the Kaplan-Meier analysis. The Number in State column indicates the number of units in a group, the State F or S column indicates whether the units in the group are failures (F) or suspensions (S), and the State End Time column records the end time of the interval.
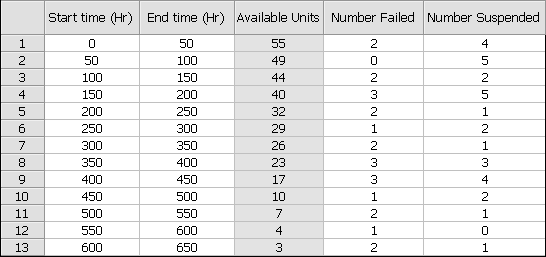
The following example shows the data sheet for the Actuarial-Simple analysis. The data sheet contains information about the start time and end time of each interval, as well as the number of units in each interval that are either failures or suspensions. The Available Units column shows the number of units at the start of each interval. The information in this column is automatically calculated by the software based on all of the entries in the Number Failed and Number Suspended columns.
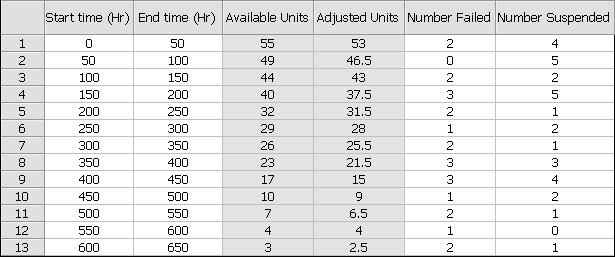
The following example shows the data sheet for the Actuarial-Standard analysis. The calculations are similar to the Actuarial-Simple analysis except that the number of units at the start of an interval is reduced by half of the number of suspensions in that interval. This results in reliability estimates that may be lower (i.e., more conservative) when compared to the results obtained by the Actuarial-Simple method.
The data sheet contains information about the start time and end time of each interval, as well as the number of units in each interval that are either failures or suspensions. The Available Units column shows the number of units at the start of the interval and the Adjusted Units column shows the value reduced by half of the number of suspensions. The data in these two columns are automatically calculated by the software based on all of the entries in the Number Failed and Number Suspended columns.
The non-parametric LDA folio control panel allows you to configure the analysis settings for the data sheet and view/access the results. It consists of multiple pages, each containing options for performing particular tasks. This topic focuses on the Main page of the non-parametric LDA control panel, which contains the tools you will need to analyze the data set. For more information about control panels in general, see Control Panels.
The Data Type area allows you to select the non-parametric method for approximating the reliability. The method you select will determine the columns that appear in the data sheet.
The Calculate Confidence check box allows you to calculate the lower and the upper one-sided confidence bounds of the reliability estimates at a specified confidence level. Specify the desired confidence level in the Level field. Selecting this option also allows you to automatically include the confidence bounds in the plot of the analysis.
The Life Data Model area contains the settings for creating a parametric model that is based on the data set obtained from the non-parametric analysis. These settings have no effect on the non-parametric analysis. The options in this area are identical to the ones on the control panel of a Weibull++ life data folio, except for the two drop-down lists shown next:
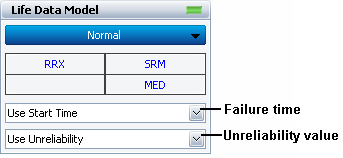
The two options allow you to choose which values will be fitted with the chosen life distribution.
Failure time: If you use the Kaplan-Meier analysis, the failure times are the end times of the intervals. If you use either the Actuarial-Simple or Actuarial-Standard analysis, each failure time may be the start time of the interval, end time of the interval, or the average between the start time and end time.
Unreliability value: If you select to include confidence bounds for the non-parametric analysis, you will have the option to select either the unreliability estimates calculated by the non-parametric analysis, or the upper confidence bounds or lower confidence bounds of the unreliability estimate.
When you click the Calculate icon on the control panel, the software analyzes the data set based on the chosen non-parametric method. It then automatically performs a separate standard life data analysis based on the settings you have specified in the Life Data Model area on the control panel.
The Non-Parametric Results area allows you to view the reliability estimates calculated by the non-parametric analysis and the free-form data set that will be used for parametric analysis. Click the Non-Parametric Results (...) button to open the Results window, which allows you to view, edit and print the report.
The Life Data Results area allows you to view the parameters of the life data model. Click the Life Data Results (...) button to open the Results window. You can also click the Quick Calculation Pad (QCP) icon on the control panel to obtain results based on the life data model, such as the probability of failure or mean life.
The folio tools are arranged on the left side of the Main page of the control panel. Use these tools to manage data and experiment with the results of your analysis.
![]() Calculate calculates the reliability estimates based on the chosen non-parametric method (i.e., Kaplan-Meier, Actuarial-Simple or Actuarial-Standard). It then performs a separate standard (parametric) life data analysis based on the settings in the Life Data Model area of the control panel. This tool is also available by choosing Non-Parametric LDA > Analysis > Calculate.
Calculate calculates the reliability estimates based on the chosen non-parametric method (i.e., Kaplan-Meier, Actuarial-Simple or Actuarial-Standard). It then performs a separate standard (parametric) life data analysis based on the settings in the Life Data Model area of the control panel. This tool is also available by choosing Non-Parametric LDA > Analysis > Calculate.
![]() Plot creates a Reliability vs. Time plot of the non-parametric analysis. The scaling, setup, exporting and other features are similar to the options available for other Weibull++ plot sheets. Features that are not applicable to this plot will be hidden or disabled. Clicking the Plot icon before the folio has been calculated will automatically calculate the folio and then plot the data. This tool is also available by choosing Non-Parametric LDA > Analysis > Plot.
Plot creates a Reliability vs. Time plot of the non-parametric analysis. The scaling, setup, exporting and other features are similar to the options available for other Weibull++ plot sheets. Features that are not applicable to this plot will be hidden or disabled. Clicking the Plot icon before the folio has been calculated will automatically calculate the folio and then plot the data. This tool is also available by choosing Non-Parametric LDA > Analysis > Plot.
![]() QCP opens the Weibull++ Quick Calculation Pad, which allows you to calculate results, such as mean life and probability of failure, based on the results of the standard life data analysis. It uses the same calculations that you can perform in a Weibull++ life data folio QCP. This tool is also available by choosing Non-Parametric LDA > Analysis > Quick Calculation Pad.
QCP opens the Weibull++ Quick Calculation Pad, which allows you to calculate results, such as mean life and probability of failure, based on the results of the standard life data analysis. It uses the same calculations that you can perform in a Weibull++ life data folio QCP. This tool is also available by choosing Non-Parametric LDA > Analysis > Quick Calculation Pad.
![]() Distribution Wizard opens the Distribution Wizard, which helps you select the distribution that best fits the data set based on the chosen parameter estimation method (i.e., RRX or RRY). In the non-parametric LDA folio, the ranking in the Distribution Wizard is based on the life data model. This tool is also available by choosing Non-Parametric LDA > Analysis > Distribution Wizard.
Distribution Wizard opens the Distribution Wizard, which helps you select the distribution that best fits the data set based on the chosen parameter estimation method (i.e., RRX or RRY). In the non-parametric LDA folio, the ranking in the Distribution Wizard is based on the life data model. This tool is also available by choosing Non-Parametric LDA > Analysis > Distribution Wizard.
![]() Change Units opens the Change Units window, which allows you to change the units for the time values in the current data sheet.
Change Units opens the Change Units window, which allows you to change the units for the time values in the current data sheet.
The Life Data Model area of the non-parametric LDA control panel gives you the ability to create a parametric model that is based on the analysis. In order to assess whether the parametric model provides a good fit to the results of the analysis, you can transfer the data to a Weibull++ life data folio. Choose Non-Parametric LDA > Transfer Life Data > Transfer Life Data to New Folio.
![]()
The data will be transferred to a free-form data sheet, where the failure time values will be copied to the “X-Axis value” column and the unreliability values will be copied to the “Y-Axis value” column. In the life data folio, you could use the plots and other results to evaluate the fit of the distribution to the values from the non-parametric analysis. If the distribution does not provide a good fit, you could experiment with other distributions to see which one would provide a better fit. Once you have selected an appropriate parametric model, you can use it to obtain calculations from the life data folio’s QCP, or to generate other graphical plots in the life data folio’s plot sheet. If you use the same analysis settings in both the life data folio and non-parametric LDA folio, then you will obtain the same results from the QCPs in both folios.
© 1992-2017. HBM Prenscia Inc. ALL RIGHTS RESERVED.
 |
E-mail Link |