![]()
![]()
This section presents an example of how to use the Expected Failure Time plot to monitor an in-progress test.
A reliability engineer is asked to perform a reliability life test for a component whose underlying life distribution is estimated to be a Weibull distribution, where beta = 2.5 and eta = 500 hours. This estimation is uncertain, however, and the engineer has been asked to monitor the test and report to management if the failure times suggest that the estimated life distribution is incorrect. Ten units will be tested under normal operating conditions.
Follow the steps outlined below to view two-sided 90% confidence bounds for the failure times of each unit in the test.
Open the Test Design Assistant by choosing Insert > Test and Planning > Test Design.
![]()
In the Test Design Assistant, select Expected Failure Times Plot and click OK. The Expected Failure Time window will appear.
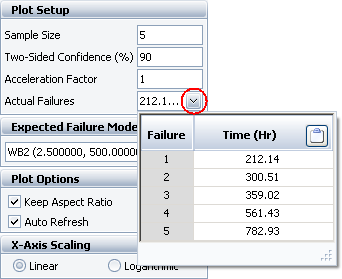
In the Plot Setup area of the control panel, enter 10 for the sample size. Then enter 90 for the two-sided confidence level. Because the units will be tested under normal operating conditions, enter 1 for the acceleration factor.
Next, enter the life distribution of the product by clicking the arrow in the Expected Failure Model area of the control panel. In the window that appears, select 2P-Weibull for the distribution. Then enter the distribution’s parameters and select Hour for the time unit.
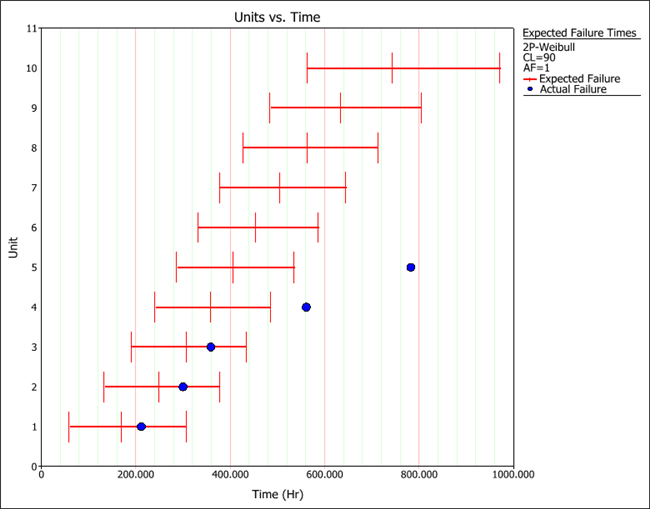
Then click the Redraw Plot icon to recalculate the expected failure times. The plot will show the predicted failure times for the ten units, with 90% two-sided confidence bounds on each prediction.
To add actual failure times to the plot, click the arrow in the Actual Failures field to enter the failure times (shown next) as they are observed during the test. The entered times will be automatically sorted from least to greatest, and they will be displayed as points on top of the lines that represent the expected failure times.
The following plot shows the first five actual failures displayed with the ten expected failure times. At this point, the engineer would inform management that the observed failure times indicate that the estimated life distribution may be inaccurate.
© 1992-2017. HBM Prenscia Inc. ALL RIGHTS RESERVED.
 |
E-mail Link |