![]()
![]()

This example uses the Stress-Dependent SimuMatic utility to verify whether a proposed test plan could be used to demonstrate, with 95% confidence, that a product has a reliability of at least 90% at 650 hours at the use stress level of 300 K.
The engineers have prior experience with a similar design, and as a result they expect the product to have an unreliability of 40% at 7,000 hours under normal conditions. At 340 K, they expect the product to follow a Weibull distribution, where eta = 500 hours. The life-stress relationship is assumed to be Arrhenius, and for all stress levels the life distribution is assumed to be Weibull, where beta = 1.5.
The proposed plan is to test 20 units at 325 K and 15 units at 340 K. All units will be tested to failure. The objective is to determine whether this test plan will meet the reliability goal:
Add a new stress-dependent SimuMatic folio to the project by choosing Insert > Simulation > SimuMatic. (If you have a Weibull++/ALTA license on your computer, you will be given a choice between "SimuMatic" or "Stress-Dependent SimuMatic." Choose Stress-Dependent SimuMatic.)
On the Main tab of the setup window, select the Arrhenius-Weibull model and select Hour (Hr) for the time unit. Enter 1.5 for the beta parameter.
Because we do not have the values of B and C available, we will use the Quick Parameter Estimator to solve for those parameters and transfer them to the setup window. Click the Quick Parameter Estimator button to open the utility. The Arrhenius-Weibull model and Hour units should be automatically selected in the Model area.
In the Quantification Method area, choose Unreliability and a Parameter.
In the Point #1 area, enter 7000 for the time and 0.4 for the unreliability.
In the Solve for Parameter area, select Eta and then enter 1.5 in the Beta field.
In the Use Stress Level area, enter 300 for the use stress level.
Click the Next> button to go the second page. Then enter 340 for the accelerated stress level and 500 for the characteristic life (i.e., eta).
Click Next> to see the calculated values for the B and C parameters, which are shown to be 7871.5321 and 4.4093E-08, respectively. Click the Update button to transfer the values to the SimuMatic setup window.
On the Stress tab of the SimuMatic window, enter the use stress level of 300 K.
On the Censoring tab, select No censoring.
On the Settings tab, set the Number of data sets to 1000. Use the default values in the other fields.
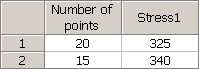
In the data sheet on the right side of the window, enter the number of units that will be tested for each stress level, as shown next.
On the Test Design tab, enter 90 in the Target Reliability field and 95 in the Lower 1-Sided Confidence Level field.
Click Generate to create and analyze the simulated data sets. A SimuMatic folio will appear.
In the SimuMatic folio, open the Results window by clicking Summary in the Additional Results area of the control panel.
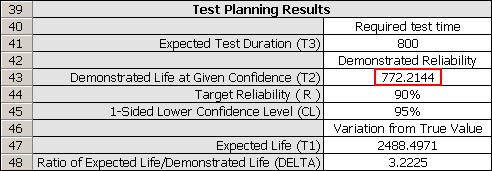
In the results, T1 confirms that the product's intrinsic reliability is high enough to meet the target reliability. Also, because T2 is greater than the time at which the engineers want to demonstrate the target reliability, SimuMatic predicts that the given test plan is acceptable. The engineers may then choose to decrease the number of points and repeat the simulation to determine whether a more efficient plan is possible. Note that your results may vary because the data were obtained through Monte Carlo simulation.
© 1992-2017. HBM Prenscia Inc. ALL RIGHTS RESERVED.
 |
E-mail Link |