![]()
![]()
Available in Weibull++, ALTA, RGA and DOE++, side-by-side plots give you the ability to display different plots for a single data set all in a single window for easy comparison.
To add a side-by-side plot to a project, choose Insert > Reports and Plots > Side-by-Side Plot.
![]()
In the window that appears, select the data sheet you want to plot and click OK to create the plot sheet.
To view a single plot in greater detail, double-click the plot. You can double-click the plot again to return to the side-by-side view.
For overlay plots in DOE++, you simply select the check box for each type of plot you want to include. For Weibull++/ALTA and RGA, there are two options:
Create different plots for the same data set. For example, you might wish to display both the Reliability vs. Time plot and the Failure Rate vs. Time plot of the data set. To create this view, you would first select the Plot Types option on the control panel and then select the desired plot types.
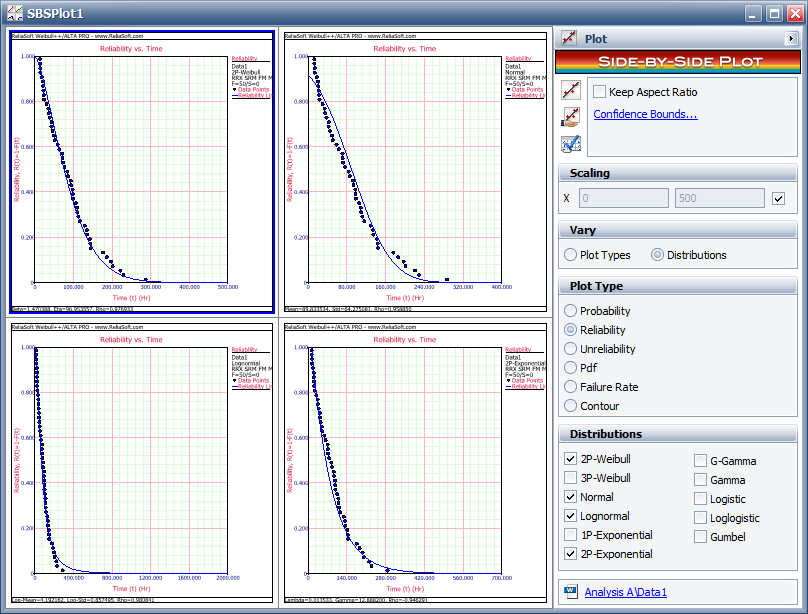
Compare how different distributions or models fit a particular data set. For example, if you want to display a reliability plot for different life distributions in Weibull++, select the Distributions option on the control panel, select the Reliability plot from the plot type list, and then select the check box for each desired distribution.
© 1992-2016. ReliaSoft Corporation. ALL RIGHTS RESERVED.
 |
E-mail Link |