![]()
![]()

A car manufacturer wants to make projections about the expected cumulative number of transmission repairs by 24,000 miles for 100 cars of the same model. The manufacturer conducted a preproduction road test and tracked the transmission repairs in a sample of 14 cars. The following table shows the data. [1]
| Car ID | Mileage at 1st Repair | Mileage at 2nd Repair | Last Observed Mileage |
| 1 | - | - | 27099 |
| 2 | - | - | 21999 |
| 3 | 11891 | - | 27583 |
| 4 | - | - | 19966 |
| 5 | - | - | 26146 |
| 6 | 3648 | 13957 | 23193 |
| 7 | - | - | 19823 |
| 8 | 2890 | - | 22707 |
| 9 | 2714 | - | 19275 |
| 10 | - | - | 19803 |
| 11 | - | - | 19630 |
| 12 | - | - | 22056 |
| 13 | - | - | 22940 |
| 14 | 3240 | 7690 | 18965 |
The first step is to enter the data into a non-parametric RDA folio data sheet, as shown next.
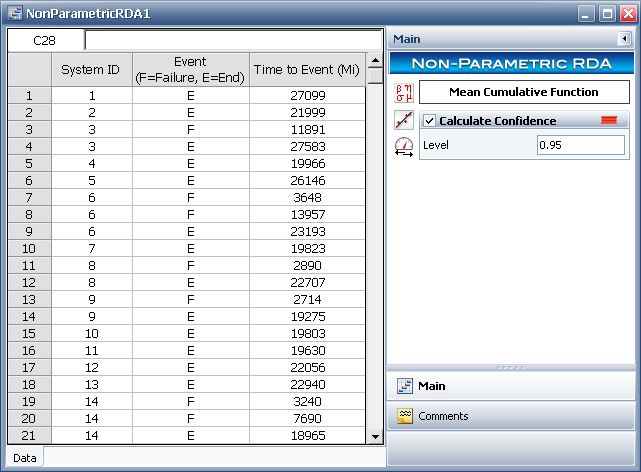
Select to calculate the confidence bounds, enter a confidence level of 0.95 and click Calculate.
Click the Show Results (...) button to open the Results window, as shown next.
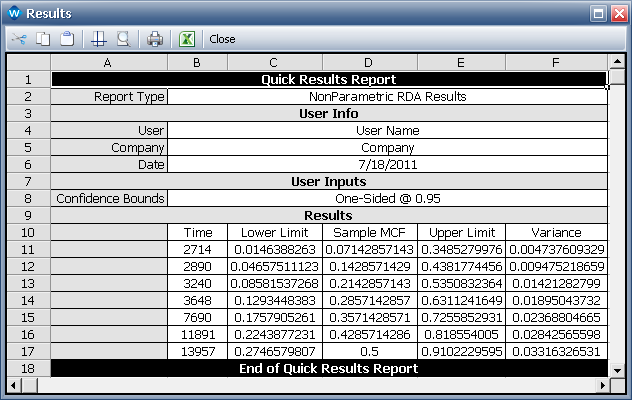
The results indicate that for the period between 2,714 and 2,890 miles, the estimated mean cumulative number of repairs per car is 0.0714. For the period between 2,890 and 3,240 miles, the estimate is 0.1429, and so on.
To view a plot of the MCF results, close the Results window and click the Plot icon on the control panel. The following plot shows the MCF and the confidence bounds. The system ages are on the x-axis and the values for the mean cumulative number of repairs per car are on the y-axis.
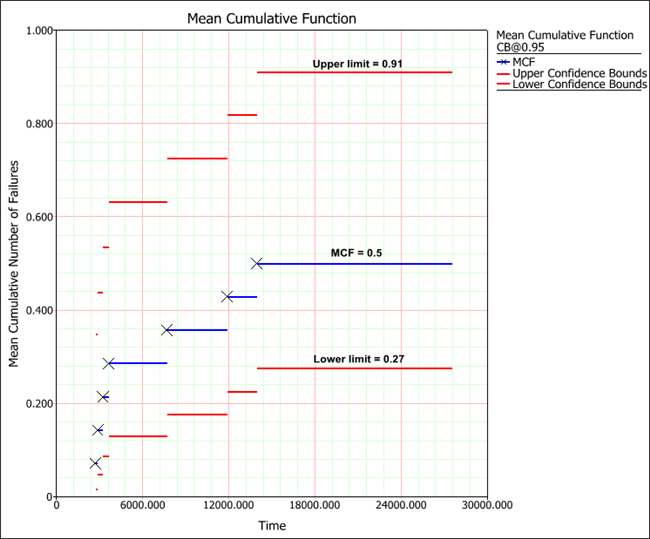
The Xs in the plot represent the system ages that were entered for the failure events. As you can see, the MCF value of 0.5 applies to the period that is between 13,957 to 27,583 miles (the latest system age entered for failure event F and the latest observed censoring age entered for end event E). Therefore, for a fleet of 100 cars, the expected number of transmission repairs by 24,000 miles is 50 (i.e., 0.5 x 100). This estimation can be useful for predicting the future number of failures, estimating repair cost and planning for spare parts.
Notice that the MCF data points on the plot grow horizontally farther apart as the population ages. If a smooth curve were drawn through the Xs on the plot, the curve would be concave down, indicating a decreasing recurrence rate. This means that the rate of repairs decreases as the cars accumulate more miles. This could also mean that the cars have a manufacturing defect and the recurrence rate will continue to decrease until all defects have been repaired.
© 1992-2016. ReliaSoft Corporation. ALL RIGHTS RESERVED.
 |
E-mail Link |