
| Related Topics: | ||
The standard folio control panel allows you to configure the analysis settings for the data sheet. It also displays the results of the analysis. This topic provides general information that applies to most analyses. For more focused information about performing a particular type of analysis, you can go directly to the topic of interest. (See Traditional Reliability Growth Analysis, Growth Projections, Planning and Management (Crow Extended Model) or Repairable Systems Analysis.)
The Main page of the control panel contains most of the tools you will need to analyze a data set. It may include some or all of the following settings.
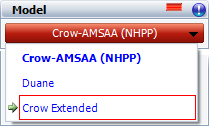
The Model area allows you to choose a statistical model to use in analyzing the data set. The list of models available will depend on the data type. See the Data Types topic for a complete list.
The Calculation Options area allows you to choose the Change of Slope analysis method for situations where there has been a significant change in the failure intensity of the system. (See Change of Slope Analysis.)
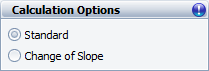
The Change of Slope option is available when you use the Crow-AMSAA (NHPP) model with the following data sheets:
All times-to-failure data types, except for Multiple Systems with Event Codes
Discrete Mixed data type
The available analysis settings may vary depending on the data type. The following picture shows an example of the settings that are available for the Failure Times data type. In this example, the settings show the type of data (Developmental – Failure Times), parameter estimation method (MLE), confidence bounds method (Crow), whether a gap interval has been defined in the analysis (No Gap) and whether the failure times are entered as cumulative or non-cumulative (Cumulative).
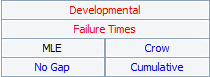
If a setting is displayed in blue text, you can click the label to switch between the available options. These settings are also available on the Analysis page of the control panel. See Control Panel Analysis Page for a description of all available settings.
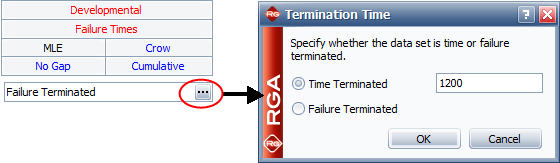
The Termination Time field is available when you use the Crow-AMSAA (NHPP) or Crow Extended models with any of the following times-to-failure data types:
Failure Times
Grouped Failure Times
Multiple Systems - Known Operating Times
This setting allows you to specify the time when the observation period ended, if applicable. Click the (...) button to open the Termination Time window, as shown next. Select the Time Terminated option to enter the actual observation time, or select the Failure Terminated option to indicate that the observation period ended with the last failure time recorded in the data sheet.
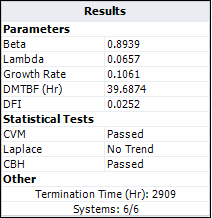
The Results area displays the calculated parameters and other results. The information shown in this area depends on the current data type and model, as well as your selections on the RGA Standard Folios page and Calculations page of the Application Setup. If you are analyzing data from multiple systems, this area may show two sets of results (see Normal and Advanced Systems View).
As an example, the following picture shows the analysis results for one particular data set and model. Clicking any of the results will open the Results window, which allows you to edit, view, copy, print or send the results to Excel.
The folio tools are arranged on the left side of the Main page. Depending on the data type or model used in the analysis, the standard folio control panel may contain some or all of the following tools:
![]() Calculate
estimates the parameters based on the selected model and analysis settings.
Once the parameters have been calculated, the Results area will show the
current results. This command is also available by choosing Growth
Data > Analysis > Calculate.
Calculate
estimates the parameters based on the selected model and analysis settings.
Once the parameters have been calculated, the Results area will show the
current results. This command is also available by choosing Growth
Data > Analysis > Calculate.
![]() Plot creates
a new sheet in the folio that provides a choice of applicable plot types.
This includes plots such as MTBF vs. time, cumulative number of failures, failure intensity
vs. time, etc. This command is also available
by choosing Growth Data > Analysis
> Plot.
Plot creates
a new sheet in the folio that provides a choice of applicable plot types.
This includes plots such as MTBF vs. time, cumulative number of failures, failure intensity
vs. time, etc. This command is also available
by choosing Growth Data > Analysis
> Plot.
![]() QCP
opens the Quick Calculation Pad,
which allows you to obtain calculated results based on the analyzed data
sheet, such as the cumulative MTBF and the
expected number of failures. This command is also available by choosing
Growth Data > Analysis > QCP.
QCP
opens the Quick Calculation Pad,
which allows you to obtain calculated results based on the analyzed data
sheet, such as the cumulative MTBF and the
expected number of failures. This command is also available by choosing
Growth Data > Analysis > QCP.
![]() Effectiveness Factors
is available only when you use the Crow Extended or Crow Extended - Continuous
Evaluation models. It opens the Effectiveness
Factors window, which allows you to define the effectiveness factors
for each BD mode to estimate the fractional decrease in failure intensity
that can be expected after the delayed fix is applied. This command is
also available by choosing Growth Data
> Crow Extended > Effectiveness Factors.
Effectiveness Factors
is available only when you use the Crow Extended or Crow Extended - Continuous
Evaluation models. It opens the Effectiveness
Factors window, which allows you to define the effectiveness factors
for each BD mode to estimate the fractional decrease in failure intensity
that can be expected after the delayed fix is applied. This command is
also available by choosing Growth Data
> Crow Extended > Effectiveness Factors.
![]() Alter Parameters
opens a tool that allows you to alter the values of the calculated parameters,
assuming that the likelihood function and Fisher Matrix (evaluated at
the original parameter estimates) remain the same. In plots, the position
of the data points remain the same, but the solution line and all subsequent
analyses made via the QCP and other tools are based on the modified parameter
values. Therefore, the analysis may be appropriate only within the context
of your specific scenario. This command is also available by choosing
Growth Data > Options > Alter Parameters.
Alter Parameters
opens a tool that allows you to alter the values of the calculated parameters,
assuming that the likelihood function and Fisher Matrix (evaluated at
the original parameter estimates) remain the same. In plots, the position
of the data points remain the same, but the solution line and all subsequent
analyses made via the QCP and other tools are based on the modified parameter
values. Therefore, the analysis may be appropriate only within the context
of your specific scenario. This command is also available by choosing
Growth Data > Options > Alter Parameters.
![]() Switch System View
allows you to switch between the two complementary views that are available
for some multiple systems data types (see Normal
and Advanced Systems View). This command is also available by choosing
Growth Data > Format & View >
Switch Systems View. This option is available only for fielded
data and some of the multiple systems data types (Concurrent Operating
Times, with Dates and with Event Codes).
Switch System View
allows you to switch between the two complementary views that are available
for some multiple systems data types (see Normal
and Advanced Systems View). This command is also available by choosing
Growth Data > Format & View >
Switch Systems View. This option is available only for fielded
data and some of the multiple systems data types (Concurrent Operating
Times, with Dates and with Event Codes).
![]() Change Units opens the Change Units window, which allows you
to change the time units of an existing data sheet. This command is available
for all data types except discrete data.
Change Units opens the Change Units window, which allows you
to change the time units of an existing data sheet. This command is available
for all data types except discrete data.
![]() Auto Group Data
opens the Auto Group Data window, which
allows you to specify the intervals that will be used to group the data.
This command is also available by choosing Growth
Data > Options > Group Data. This option is available for
data types where the exact failure times have been recorded (i.e., Failure
Times and Multi-Phase Failure Times) and for the Fleet data type.
Auto Group Data
opens the Auto Group Data window, which
allows you to specify the intervals that will be used to group the data.
This command is also available by choosing Growth
Data > Options > Group Data. This option is available for
data types where the exact failure times have been recorded (i.e., Failure
Times and Multi-Phase Failure Times) and for the Fleet data type.
![]() Mission Profile Analysis
is available only for the Failure Times data sheet. It applies to cases
where testing involves multiple test profiles. This command allows you
to select a mission profile in the project that you want to use to analyze
the data set. The data in the current data sheet will be transferred to
a new data sheet in the same folio, and then grouped according to the
"convergence points" in the specified mission profile. (See
Mission Profiles.)
Mission Profile Analysis
is available only for the Failure Times data sheet. It applies to cases
where testing involves multiple test profiles. This command allows you
to select a mission profile in the project that you want to use to analyze
the data set. The data in the current data sheet will be transferred to
a new data sheet in the same folio, and then grouped according to the
"convergence points" in the specified mission profile. (See
Mission Profiles.)
![]() Event Report
is available for all multi-phase data types and for the Multiple Systems
with Event Codes data type. It opens a report about the failure modes
in the current analysis, such as the classification of the modes, their
first times to failure and effectiveness factors. This command is also
available by choosing Growth Data >
Analysis > Event Report. (See Event
Reports.)
Event Report
is available for all multi-phase data types and for the Multiple Systems
with Event Codes data type. It opens a report about the failure modes
in the current analysis, such as the classification of the modes, their
first times to failure and effectiveness factors. This command is also
available by choosing Growth Data >
Analysis > Event Report. (See Event
Reports.)
![]() Batch Auto Run
opens the Batch Auto Run window, which
allows you to quickly extract data from an existing data sheet based on
the system ID, phase or analysis point. This command is also available
by choosing Growth Data > Options
> Batch Auto Run. It is available only for multi-phase data,
fielded data and some of the multiple systems data types (Concurrent Operating
Times, with Dates and with Event Codes).
Batch Auto Run
opens the Batch Auto Run window, which
allows you to quickly extract data from an existing data sheet based on
the system ID, phase or analysis point. This command is also available
by choosing Growth Data > Options
> Batch Auto Run. It is available only for multi-phase data,
fielded data and some of the multiple systems data types (Concurrent Operating
Times, with Dates and with Event Codes).
![]() Transfer to New Data
Type opens the Transfer
to New Data Type window, which allows you to select the data type
into which you would like to transfer the data. This command is also available
by choosing Growth Data > Transfer
Life Data > Transfer to New Data Type. This option is available
only for fielded data and some of the multiple systems data types (Concurrent
Operating Times, with Dates and with Event Codes).
Transfer to New Data
Type opens the Transfer
to New Data Type window, which allows you to select the data type
into which you would like to transfer the data. This command is also available
by choosing Growth Data > Transfer
Life Data > Transfer to New Data Type. This option is available
only for fielded data and some of the multiple systems data types (Concurrent
Operating Times, with Dates and with Event Codes).
![]() Transfer to Weibull++
opens the Transfer to Weibull++
9 window, which allows you to transfer the current RGA data set to
a new standard folio data sheet in Weibull++ (ReliaSoft's life data analysis
software). This command is also available by choosing Growth
Data > Transfer Life Data > Transfer to Weibull++. It is
available for time-to-failure data (except Multiple Systems – Known Operating
Times), multi-phase data (except Mixed Data) and fielded data.
Transfer to Weibull++
opens the Transfer to Weibull++
9 window, which allows you to transfer the current RGA data set to
a new standard folio data sheet in Weibull++ (ReliaSoft's life data analysis
software). This command is also available by choosing Growth
Data > Transfer Life Data > Transfer to Weibull++. It is
available for time-to-failure data (except Multiple Systems – Known Operating
Times), multi-phase data (except Mixed Data) and fielded data.
© 1992-2015. ReliaSoft Corporation. ALL RIGHTS RESERVED.