
| Related Topics: | ||
RGA's growth planning folio helps you to use the Crow Extended growth planning model to plan a single- or multi-phase reliability growth test program that is designed to achieve a specific MTBF goal.
To create a growth planning folio, choose Insert > Folios > Growth Planning.
![]()
This topic describes how to use the first sheet in the folio (the Data sheet) to create a reliability growth test program plan. Subsequent topics will discuss:
Using the Plot sheet to visualize the results expected if you implement the test plan.
Using the QCP to calculate a variety of metrics based on the test plan.
You can also review a case study example that demonstrates how the growth planning folio can be used in conjunction with a multi-phase plot to track the actual test results against the plan.
On the first sheet in the folio (the Data sheet), do the following:
In the first Do you know...? area at the top of the data sheet, select Yes if you want to specify the end time (and other details) for each phase of testing. If you want to create a plan for a single test phase with no specific end time, select No and skip to step #3.
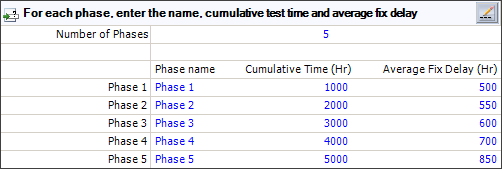
When you have indicated that the planned phase times are known, the Number of Phases field in the last area of the data sheet determines the number of rows in the table at the bottom area. Specify the number of phases and then use the following fields to define each phase.
The Phase Name can be any alphanumeric identifier you prefer, up to 50 characters.
The Cumulative Time is the amount of cumulative test time at the end of each phase. Because this represents cumulative test time across all test phases, the number must be higher for each subsequent phase.
The Average Fix Delay is the amount of test time from when a failure mode is discovered until a fix is likely to be implemented.
As an example, the following picture shows the inputs for a multi-phase test with 5 test phases that last 1,000 hours each. In the first phase, the planners estimate that delayed fixes (for BD failure modes) will, on average, take 500 hours each. The fix time is expected to increase in later phases.
If there are a lot of test phases and/or if you have this information available in an external data file, you can click the Edit Phase Data icon ![]() to open a more flexible spreadsheet for entering/editing these details. The Import icon
to open a more flexible spreadsheet for entering/editing these details. The Import icon ![]() at the bottom of this window allows you to import data from an Excel spreadsheet (*.xls) if desired.
at the bottom of this window allows you to import data from an Excel spreadsheet (*.xls) if desired.
The Crow Extended growth planning model considers seven variables; you can select to solve for one of them (except discovery beta and average fix delay) and then you will be prompted to input the rest. In the Which value would you like calculated? area, first select the metric you want to calculate. This will update the list of values that you need to provide.
Initial MTBF is the MTBF before the test program begins. It can be determined by some initial testing or through historical information, engineering expertise and/or reliability predictions.
Goal MTBF is the MTBF requirement that you need to achieve by the end of the test program.
Growth Potential Design Margin estimates the amount by which the growth potential MTBF (i.e., the MTBF that would be achieved if you continued testing until all failure modes are observed and corrected according to the current maintenance strategy) exceeds the goal MTBF. This value provides a "safety factor" to ensure that the reliability requirement is met. A higher GP design margin means there's a smaller risk that the reliability observed in the field will not meet the requirement, but it also means a more rigorous reliability growth program will be required. Typically, the GP design margin is between 1.2 and 1.5.
Average EF (where EF = effectiveness factor) estimates the fractional decrease in failure intensity you expect to achieve by implementing design fixes. Typically, about 30% of the failure intensity for the failure modes that are addressed will remain in the system after implementing all of the design fixes; therefore, in many reliability growth programs, the average effectiveness factor is 0.7. The value must be greater than 0, and less than 1.
Management Strategy Ratio is a ratio that determines the percentage of the unique failure modes discovered during the test that will be fixed. This is an important variable in reliability growth planning because the management strategy can be changed to address a larger percentage of the discovered failure modes if the MTBF goal cannot be reached with the current strategy. Generally, the management strategy is recommended to be above 90%.
Discovery Beta is the rate at which new, unique B failure modes are being discovered during testing. These are the failure modes that will be fixed. In growth planning, it is assumed that most failures will be identified early on, and that new failure modes will be discovered at a decreasing rate as the test proceeds. Therefore, this value must be greater than 0 and less than 1. This input is always required; you cannot solve for the discovery beta.
Average Fix Delay is required only if you didn't enter fix delay information for different test phases. This value is the amount of test time from when a failure mode is discovered until a fix is likely to be implemented.
Once you have entered all of the required inputs, choose Growth Planning > Analysis > Calculate or click the icon in the control panel.
![]()
The following results will be displayed at the bottom of the data sheet:
Time at which growth begins is the estimated time when the first B failure mode (i.e., the first failure mode that will be fixed) is expected to occur. Reliability growth is expected to begin after this time.
The second row displays the result for whichever value you selected to solve for: Initial MTBF, Goal MTBF, Growth Potential Design Margin, Average EF or Management Strategy Ratio.
Time to reach goal is the test time at which the goal MTBF is expected to be reached. Two versions of this value are calculated. The Actual value also takes into account the average fix delay, and the Nominal value does not. If the current test plan will not meet the goal, this field displays "Goal not met" instead of a time.
You can also choose Growth Planning > Analysis > Show Results or click the icon in the control panel to see a summary of the inputs and results in the Results window.
![]()
© 1992-2015. ReliaSoft Corporation. ALL RIGHTS RESERVED.