
When you create a new multi-phase plot or click the Multi-Phase Plot Setup button in an existing plot, the Multi-Phase Plot Wizard allows you to specify the data source(s) for the plot. The test data displayed in the plot can come from:
One Multi-Phase data sheet that includes all of the analysis points and phase data defined together in a single data source. [See details below.]
or
Multiple Data Sheets that each contain the data from one particular analysis point or phase. This requires you to assign a specific data sheet to each analysis point and phase you want to display in the plot. [See details below.]
After you have defined the test data source(s), the wizard also allows you to select an applicable growth planning folio, if desired. Use this option if you want to use the plot to compare the test results against what was expected based on the reliability growth program plan.

Click Finish when you’re ready to save the changes and create or return to the Multi-Phase Plot window.
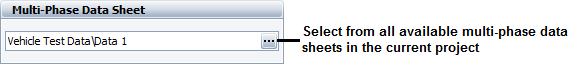
If you select Multi-Phase and proceed to the next page in the wizard, you will be prompted to select a single analyzed multi-phase data sheet that contains all of the test phases and analysis points already defined in a single data sheet.
If you select Multiple Data Sheets and proceed to the next page in the wizard, you will be prompted to select the separate data sheets that contain the data for each analysis point and phase you wish to display in the plot. The data sheets must be calculated with either the Crow Extended or Crow Extended – Continuous Evaluation model, and each sheet can be used only once in the same plot.
If you don’t wish to include analysis points in the plot, you can simply specify the number of phases at the top of the window and then select one data sheet on the tab for each phase.
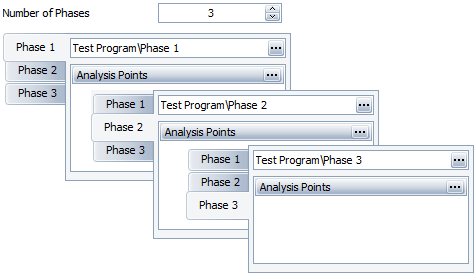
If you want to include analysis points, there must be a separate data sheet that contains the data for each analysis point, in addition to the data sheets that contains all of the data for each entire test phase.
For example, in the following picture, the data from the first week of testing were recorded and analyzed in four separate data sheets (in which each sheet contains all of the data up to a specific point in time).
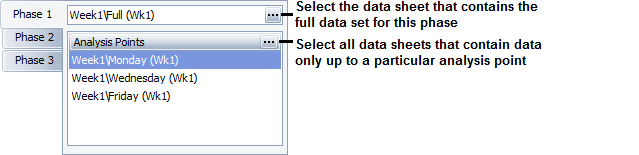
In other words:
"Monday (Wk1)" contains the data from Sunday and Monday.
"Wednesday (Wk1)" contains all of the data from Monday's data sheet, plus the additional data collected on Tuesday and Wednesday.
"Friday (Wk1)" contains all of the data from Wednesday's data sheet, plus the additional data collected on Thursday and Friday.
"Full (Wk1)" contains all of the data from Friday's data sheet, plus the additional data collected on Saturday. This data sheet contains all of the data from phase 1.
To select the data sheets for the analysis points, click the (...) button in the Analysis Points bar. In the Select Data Sheets window that opens, select the check box for all the data sheets that contains analysis point data for the current phase.
To remove a data sheet from the Analysis points list, you can return to the Select Data Sheets window and clear the check box, or simply double-click the data sheet name in the list.
© 1992-2019. HBM Prenscia Inc. ALL RIGHTS RESERVED.
| E-mail Link |