
The Interval Goodness-of-Fit Test window helps you to group failure times into intervals so that the chi-squared goodness-of-fit test will pass when you analyze the grouped data. You specify the intervals that you are considering and the tool automatically determines the actual number of failures that were observed at the specified intervals and the number of expected failures based on the Crow AMSAA (NHPP) model. It then compares the observed vs. expected number of failures in order to evaluate how well the Crow-AMSAA (NHPP) model will fit the data when grouped into the proposed intervals.
If the model fits the data, the result will indicate that the data set passed the test; but if there is a large difference between the observed and expected number of failures, the test may fail. In this case, the model may not be representative of the data and you will need to adjust the specified intervals such that the test passes.
The ReliaWiki resource portal provides more information about the chi-squared analysis at http://www.reliawiki.org/index.php/Crow-AMSAA_(NHPP).
This tool is available only for fielded data and some of the multiple systems data types (Concurrent Operating Times, with Dates and with Event Codes).
To use the tool, first calculate the parameters of the data set, and then choose Growth Data > Options > Interval GOF.
![]()
The following picture shows an example of how to use the utility. The End Time column displays the interval end times that you want to consider. The Observed Failures column displays the observed failures at the specified interval end time. The Expected Failures column shows the number of failures that would be expected for that interval based on the Crow-AMSAA (NHPP) model. Note that the termination time of the test is automatically entered for you (in this example, the termination time is 2,909 hours).
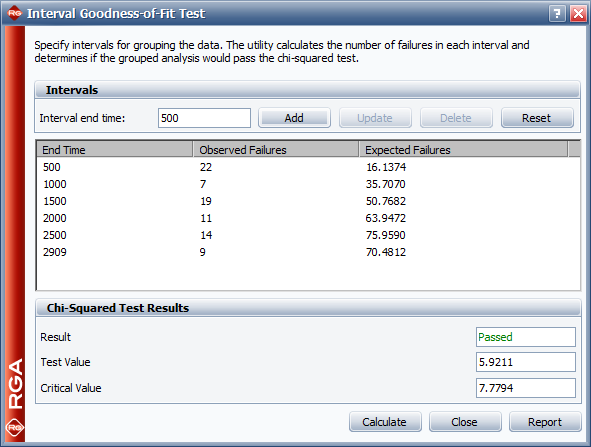
To add an interval to be considered, enter a value in the Interval end time field and click Add.
To change an interval, select the row, enter a new value in the Interval end time field and click Update.
To remove an interval, select the row and click Delete. Alternatively, you can remove all the intervals that were entered by clicking Reset.
Once you have specified all of the intervals that you want to consider for grouping the data, click Calculate to perform the test. The Result field displays whether the test passed or failed.
You can click Report to open a summary of the analysis in the Results window. If you want to proceed with the grouped data analysis, you can copy the "End Time" and "Observed Failures" values into a new Grouped Failure Times data sheet.
© 1992-2017. HBM Prenscia Inc. ALL RIGHTS RESERVED.
 |
E-mail Link |