
|
Traditional Reliability Growth Analysis |
||
Failure discounting applies to the analysis of discrete data (also known as success/failure or attribute data), in which the data set records the success or failure of each one-shot trial (e.g., of a missile or other type of device that either succeeds or fails). In RGA, you can perform failure discounting by using the Discrete Sequential with Mode data type.
This analysis is used to track the possible recurrence of a failure mode after a fix has been applied. If the mode does not appear again in the later trials, then the probability of failure due to that mode is reduced. The amount of reduction is related to the consecutive number of successful tests after the fix was applied. The following equation describes this relationship:
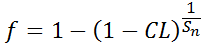
where f is the failure value due to the mode, CL is the confidence level and Sn is the number of additional successful tests after the first success following the fix.
For example:
In trial#1, failure mode A occurred. The failure value due to this mode is 1 (i.e., counted as one failure). A permanent fix is then applied for mode A.
In trial#2, mode A did not recur. This marks the first success after the fix was applied. The failure value due to this mode is still counted as 1.
In trial#3, mode A did not recur; therefore, Sn = 1, and the failure value due to mode A is reduced to 0.9, based on a 90% confidence level.
In trial#4, mode A did not recur; therefore, Sn = 2, and the failure value due to mode A is further reduced to 0.684, based on a 90% confidence level.
In trial#5, mode A occurs again, and because a second fix now needs to be applied, the failure value due to this mode resets back to 1.
Failure discounting has the effect of reducing the total number of failures in the analysis, which results in a higher reliability estimate. The following example illustrates this effect.
The data set used in this example is available in the example database installed with the software (called "RGA11_Examples.rsgz11"). To access this database file, choose File > Help, click Open Examples Folder, then browse for the file in the RGA sub-folder.
The name of the project is "Discrete Data - Sequential with Mode."
The ReliaWiki resource portal provides the mathematical calculations behind this example at http://www.reliawiki.org/index.php/Failure_Discounting.
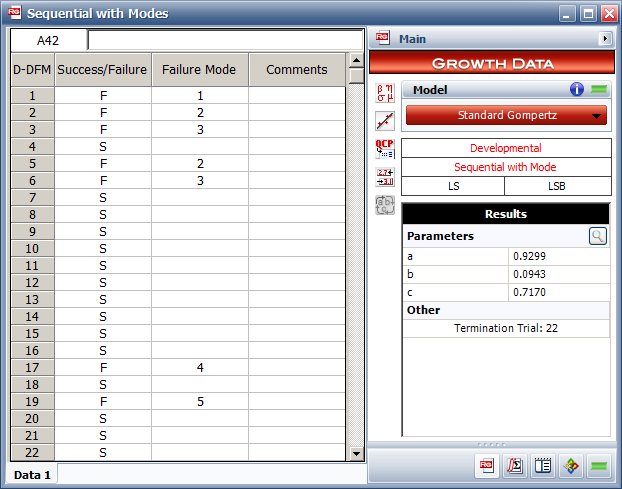
A device under development undergoes a reliability growth program. A total of 22 trials are performed and the result of each trial is recorded in the Discrete Sequential with Mode data sheet. Whenever a failure occurs, a fix is applied to the device and the failure mode that caused the failure is recorded.
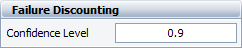
On the Analysis page of the control panel, enter 0.9 for the confidence level in the Failure Discounting area, as shown next.
Select the Standard Gompertz model and then analyze the data set by choosing Growth Data > Analysis > Calculate or by clicking the icon on the Main page of the control panel.
![]()
The following picture shows the data set and the parameters of the model.
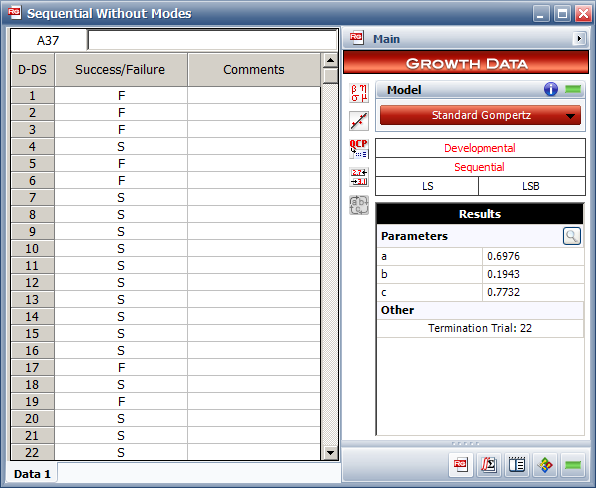
To compare how failure discounting affects the reliability estimates, copy the Success/Failure data and paste them into a Discrete Sequential data sheet. Analyze that data sheet using the Standard Gompertz model.
The following picture shows the copied data set and the parameters of the Standard Gompertz model, this time, without failure discounting.
To create an overlay plot that compares the results of the two analyses, choose Insert > Reports and Plots > Overlay Plot.
![]()
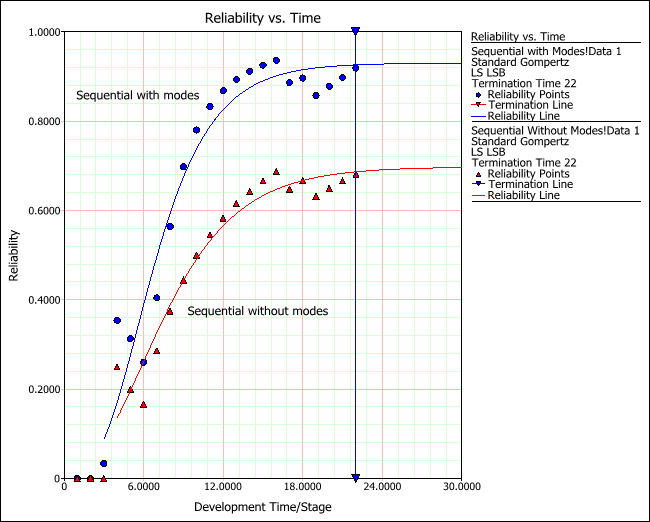
When prompted to select which data sheets to plot, select the two data sheets you have been working with. The following picture shows the resulting overlay plot (with annotations added via RS Draw to make the plot easier to interpret). It shows that the reliability estimates are higher when failure discounting is used because of its effect of reducing the total number of failures in the analysis.
© 1992-2017. HBM Prenscia Inc. ALL RIGHTS RESERVED.
 |
E-mail Link |