
The data set used in this example is available in the example database installed with the software (called "RGA11_Examples.rsgz11"). To access this database file, choose File > Help, click Open Examples Folder, then browse for the file in the RGA sub-folder.
The name of the example is "Mission Profiles," and the folio that contains the data is called "Tank Testing Profile."
A team is working on a military system that must perform three tasks:
firing a gun
moving under environment 1
moving under environment 2
They use a mission profile to create a test plan that defines the expected accumulated usage values for each task, and includes the same four convergence points (100, 250, 320 and 400 hours) in each task's profile. The purpose of these convergence points is to make sure that the usage levels for all three tasks match up at those specific times (even if there is some variation from the test plan in between convergence points).
When the team performs the test, they record the actual usage values in the mission profile folio, and they record the failure times data in an RGA growth data folio.
The mission profile folio called "Tank Testing Profile" shows the actual and expected usage for all three tasks. As shown next, the plot shows all three planned mission profiles together with the actual usage during the test. For example, the straight blue line shows the planned usage for the gun firing task and the jagged black line shows the actual usage during the test. You can see that the actual usage tends to fluctuate around the plan (due to normal variations under actual test conditions), but always meet the target at each of the four convergence points. The same applies for the actual usage on the environment 1 and environment 2 tasks.
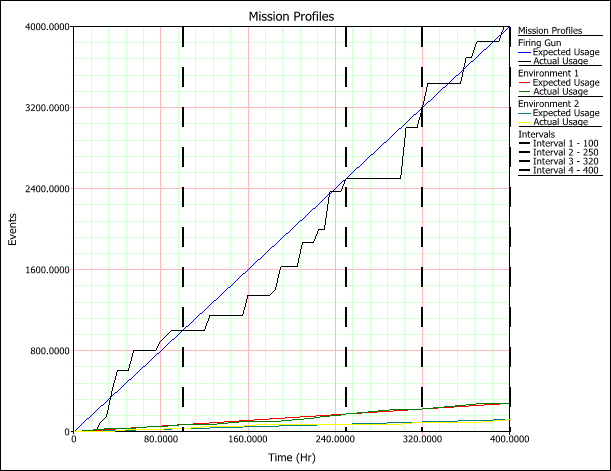
The plot can be used to track whether the test is proceeding according to plan. In addition, the mission profile folio can also assist with data analysis by automatically grouping the data based on the specified convergence points.
If there has been significant variation from the test plan in between the convergence points, this means that the usage values for the three tasks may not have been properly balanced at certain points in time, and an analysis of the exact failure times may give misleading results. For this example, the team decides to group the data at the convergence points so they can be sure that the usage of all three tasks has been synchronized according to the plan.
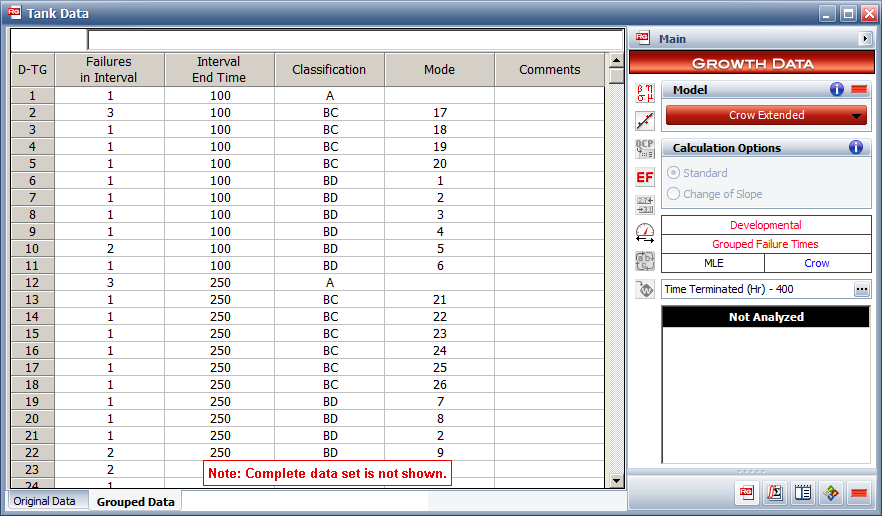
The "Tank Data" growth data folio contains the failure times observed during the test. The first data sheet (called "Original Data") contains the exact failure times. To create the second sheet (called "Grouped Data"), the analyst simply opened the original data sheet and clicked the Mission Profile Analysis icon on the control panel.
![]()
When prompted, he selected the applicable mission profile and the application automatically grouped the data. The following picture shows the grouped data analysis, which is based on balanced usage values for the three different tasks.
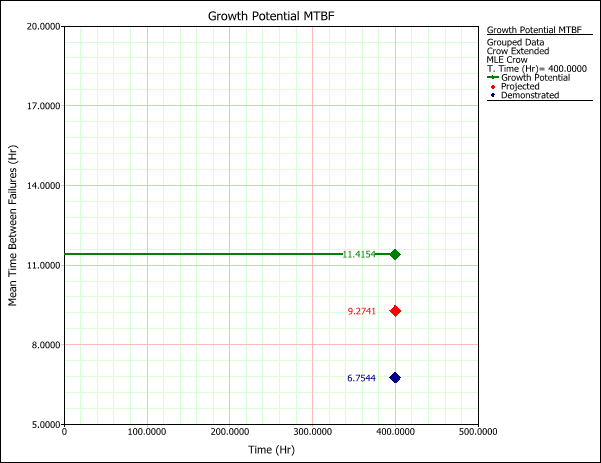
The following plot shows some useful planning metrics obtained from the grouped data analysis with the Crow Extended model: the demonstrated, projected and growth potential MTBFs.
© 1992-2017. HBM Prenscia Inc. ALL RIGHTS RESERVED.
 |
E-mail Link |