
| Related Topics: | ||
RCM++ provides a cause and effect diagram and a failure relationship diagram to help you to visualize the relationship among the events described in your analysis.
The two types of diagrams are presented in more detail below.
RCM++ allows you to automatically create a cause and effect diagram based on the current analysis. The cause and effect diagram (also know as a fishbone or Ishikawa diagram) is available for items and effects and it presents all of the events that lead up to the selected effect or item failure.
To generate a cause and effect diagram for an item, select the item and choose System Hierarchy > Diagrams > Cause and Effect Diagram. To generate a cause and effect diagram for an effect, select the effect and choose FMEA > FMEA Records > Effects > Cause and Effect Diagram.
![]()
If you have not previously created and saved the diagram, it automatically displays. If there is an existing diagram, you will be prompted to either open the previously saved diagram, delete the previously saved diagram or replace it with a new one. When you close the diagram, a window will appear asking if you want to save the diagram.
Although the cause and effect diagram does not have the traditional look of the Ishikawa or fishbone diagram, it can be read the same way. An example of an Ishikawa diagram and the same diagram as it appears in the cause and effect diagram is shown next.
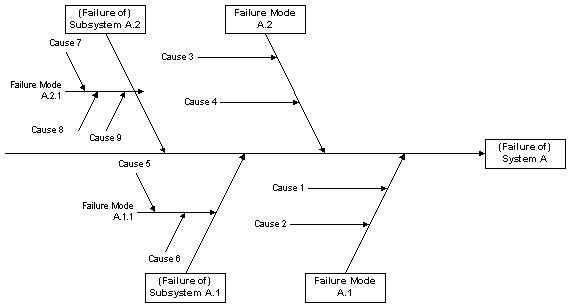
Ishikawa Diagram
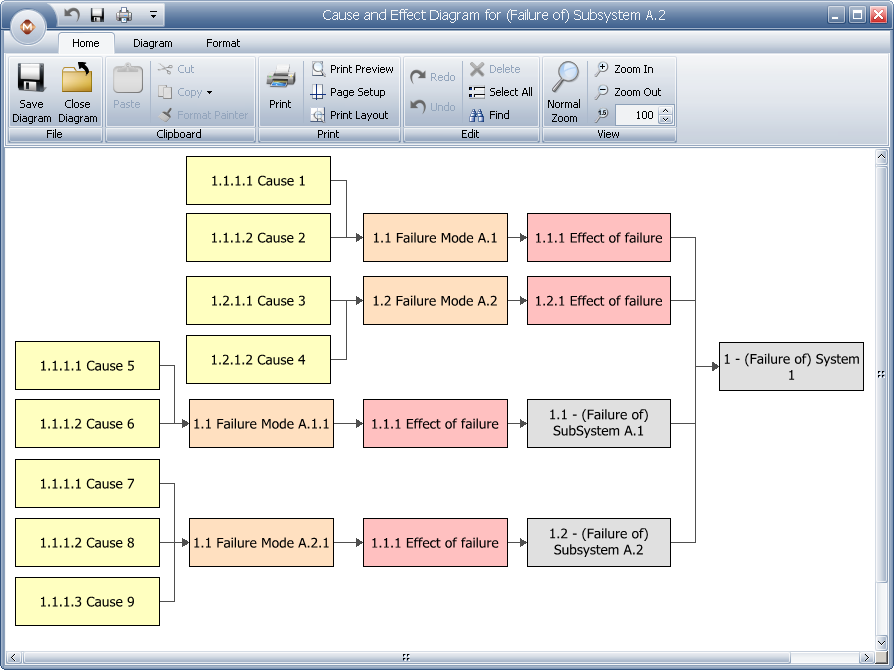
Cause and Effect Diagram for an Item Record
In the cause and effect diagram, the item or effect record you selected will appear on the far right side of the diagram. In the picture shown above, the "Failure of System A" is the item being analyzed. The events that lead to the selected event are presented to the left, the events that lead to those events are presented to the left of that, and so on until you get the basic causes that have been defined in the project.
If an item record is selected in the project, the last block(s) in the cause and effect diagram implies the failure of that item (i.e., in the above image, Cause 1, Cause 2, Cause 3 and Cause 4 are the causes of the failure). If the item has sub-items, there will be additional blocks that represent the failures of those items (assuming a reliability-wise series configuration in which the failures of any item results in the failure of the system). As shown above, the failures and causes that have been defined for these items are also included in the diagram.
If you create a cause and effect diagram for an effect record, the diagram will consist simply of the failures that lead to that effect and the causes that lead to those failures. A cause and effect diagram for an effect record is shown in the following figure.
.png)
Cause and Effect Diagram for an Effect
RCM++ allows you to automatically create a failure relationship diagram based on the current analysis. The failure relationship diagram is available for failures and it presents all of the causes and effects that have been defined for the selected failure.
To generate a failure relationship diagram, select the failure record that you want to create the diagram for in the Analysis panel and choose FMEA > FMEA Records > Failures > Relationship Diagram.
If you have not previously created and saved the diagram, it automatically displays. If there is an existing diagram, you will be prompted to either open the previously saved diagram, delete the previously saved diagram or replace it with a new one. When you close the diagram, a window will appear asking if you want to save the diagram.
An example of a failure relationship diagram is shown next.
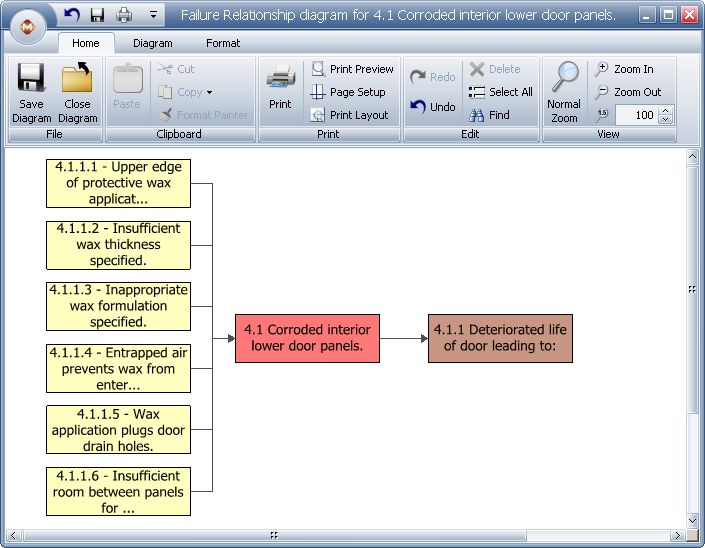
This example shows the failure record (block 4.1) in the middle of the diagram with all of the causes that have been defined for the failure on the left (blocks 4.1.1.1. through 4.1.1.6) and all of the effects on the right (block 4.1.1.). The arrows in the diagram demonstrate the flow with the causes leading to the failures and the failures leading to the effects.
© 1992-2015. ReliaSoft Corporation. ALL RIGHTS RESERVED.