
 |
Related Topics: | |
The FMRA can perform a variety of analytical and simulation-based calculations. These calculations are based on the configuration of the FMRA hierarchy and the properties that you define for the records in the hierarchy.
This topic contains information on:
To perform any of the FMRA's calculations, you must first set up the FMRA hierarchy and define the relevant properties for each record:
Add the system and all the records that could impact its reliability to the FMRA hierarchy. See Working with Records in the FMRA.
In the FMRA, set the reliability policy for all records. By default, when you select the "Inherit" policy, the software assumes a reliability-wise series configuration (i.e., the software assumes an item will fail if any of its sub-items fail or if any its causes occur).
Items will typically inherit their reliability from their sub-items and cause records. Thus, URDs will typically be assigned at the item level and cause level.
In some cases, you may have to assign URDs at the failure or function level. For example, you would assign a URD at the failure level for quantitative criticality analysis, or if you knew the probability of a particular failure mode occurring, but you didn't have that information for its causes.
You can also select policies that assign models to records based on occurrence ratings or failure probability ratings. See Using Rating Scales in the FMRA.
Tip: To perform more complex calculations that do not assume a series configuration, you can use ReliaSoft's BlockSim 8 software to synchronize the FMRA with reliability block diagrams. The blocks can then be arranged in any configuration that is supported by BlockSim.
On the Properties tab of the Analysis panel, define the following properties for each item.
Note: The fields that are enabled in the interface will depend on the interface style settings that have been defined for the current project. You can choose Project > Management > Configurable Settings > Interface Style to open the Edit Interface Style (This Project) window and change the settings for the current project.
Qty per System: Quantity of identical items in the system (e.g., 4 engines per airplane).
Operating Time: The amount of time for which the system is expected to operate. The reliability calculated for the system is the reliability at the specified operating time. This can be modified at the system level only. When you perform a simulation-based calculation, you can also edit this value in the simulation settings.
Current Age: Defines the age of the item at the start of the analysis. It allows you to define items that have already accumulated age prior to the start of the current mission (i.e., used components).
Duty Cycle: Allows you to model situations where the actual usage of an item during system operation is not identical to the usage for which you have data. This can include situations where the item:
Does not operate continuously (e.g., a DVD drive that was tested in continuous operation, but in actual use within a computer accumulates only 18 minutes of usage for every hour the computer operates).
Is subjected to loads that are greater than or less than the rated loads (e.g., a motor that is rated to operate at 1,000 rpm but is being used at 800 rpm).
Is affected by changes in environmental stress (e.g., a laptop computer that is typically used indoors at room temperature, but is being used outdoors in tropical conditions).
Continuous operation at the rated load is considered to be a duty cycle of 1. Any other level of usage is expressed as a percentage of the rated load value or operating time. For example, consider the DVD drive mentioned above; its duty cycle value would be 18 min / 60 min = 0.3. A duty cycle value higher than 1 indicates a load in excess of the rated value.
Maintenance Group: Allows you to choose or create a maintenance group to assign to the item. A maintenance group is a set of items where some event within the group can trigger maintenance for one or more items, either within the group or outside of it. (This field is not applicable for reliability and criticality calculations.)
Target Reliability/Availability: These optional fields are not required to perform calculations, but they allow you to record the reliability/availability that you hope to achieve and compare it to the calculated value.
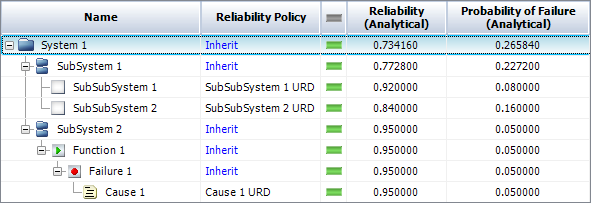
To calculate the reliabilities of the records after you set up the FMRA hierarchy, choose FMRA > RAM Analysis > Calculate (Reliability). The reliability for each record at the specified operating time will appear in the Reliability (Analytical) column of the FMRA, if the column is selected to be displayed.
The reliability for each item will also be displayed in the Current Reliability field of the Properties tab when the item is selected. This value will be highlighted in red if it is below the specified target reliability.
You can also show the calculated probability of failure (1 – R) by displaying the Probability of Failure (Analytical) columns, as shown next. If you display the Analytical Results Status column (also shown next), it will show green indicator lights when the results are based on the current inputs, and red lights when the results are not current.
Tip: If you are using the FMRA to estimate the system's baseline reliability, you may wish to thoroughly review and vet the first draft of the FMRA in order to improve the results. The ReliaWiki resource portal has more information on estimating reliability with the FMRA at: http://www.ReliaWiki.org/index.php/Using_FMRA_to_Estimate_Baseline_Reliability.
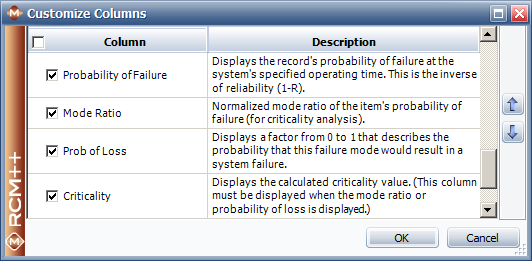
If you wish to perform a quantitative criticality analysis, the software can calculate the probabilities of failure and use that information to calculate the criticality. Before you can calculate the criticality, you must make sure the applicable criticality analysis fields have been enabled for the project. To see the calculated values, make sure the four columns shown next are selected in the Customize Columns window, which you can access by right-clicking any of the column headers in the FMRA.
For more information on performing quantitative criticality analysis, see Quantitative Criticality Analysis.
The FMRA can also be used to perform simulation-based calculations to predict the system's availability, the cost of operation and other values based on the reliability and the maintenance characteristics of the FMRA records.
In simulation, random failure times are generated from each component's failure distribution. These failure times are then considered in accordance with the way the components are reliability-wise arranged within the system. The overall results are analyzed in order to determine the behavior of the entire system. Simulation can be used for complex scenarios involving a multitude of probabilistic events, such as corrective maintenance, preventive maintenance, inspections, imperfect repairs, crew response times, spare part availability, etc.
To perform system availability and cost calculations, set up the FMRA and then choose FMRA > RAM Analysis > Simulate (Availability). A window will open where you can change the simulation settings. Click OK to perform the simulation. The following values are obtained from the simulation and may be shown on the FMRA tab of the System panel. To change which results columns are visible, right-click the column headers of the FMRA, then click Customize Columns.
Simulation Results Status displays a green indicator light if the simulations results are based on the current inputs. It displays a red light if they are not.
Operating Cost displays the total costs that accrued during the simulation.
Cost per Operating Time displays the operating cost divided by the total operating time.
Note: It is not possible to simulate failure times for components whose reliability is defined by a constant value. Failure times can be simulated only in contexts where reliability is time-dependent. Thus, the calculated operating costs for any component with a constant reliability will be zero. In these situations, it may be advisable to change the model from a constant value to a time-dependent distribution. See Changing Constant Probability Models to Distributions.
Reliability (Simulation) displays the reliability (obtained via simulation) at the operating time.
Availability displays the average availability (i.e., uptime divided by total operating time). This is a metric that reflects the probability that the item is operational (not failed or undergoing repair) when it is requested for use during the simulation.
RS FCI shows the ReliaSoft Failure Criticality Index for each item. This is a relative index showing the percentage of times a failure of the component caused a system failure (i.e., the number of system failures caused by the component divided by the total number of system failures). Note that this relates only to failures; it does not include every event that could bring the system down (such as routine maintenance).
RS DECI shows the ReliaSoft Downing Event Criticality Index for each item. This is a relative index showing the percentage of times that a downing event of the component caused the system to go down (i.e., the number of system downing events caused by the component divided by the total number of system downing events). Note that this only relates to downing events with a non-zero duration.
RS DTCI shows the ReliaSoft Downtime Criticality Index for each item. This is a relative index showing the contribution of each component's downtime to the system’s downtime (i.e., the system downtime caused by the component divided by the total system downtime).
© 1992-2013. ReliaSoft Corporation. ALL RIGHTS RESERVED.