
Once you have applied a derating standard and defined the derating properties of each component, Lambda Predict automatically evaluates each component to determine whether it meets the derating requirements provided by the standard you are working with. The results can be displayed in both the System Hierarchy panel and in the Component Derating window.
The system hierarchy includes two columns that show derating information. (To hide or display columns, right-click anywhere in the system hierarchy, and then click Customize Columns to select which columns you want to display. These settings are stored per computer/username on the System Hierarchy page of the Application Setup, so any project that you open on this computer will have the same columns displayed.)
The Derating column displays two types of information, depending on the item. For standard items (i.e., ![]() ,
, ![]() ,
, ![]() ,
, ![]() or
or ![]() ), it displays the name of the derating standard that is applied to all the components under that item. For components, it shows the derating status (i.e., not stressed, exceeded nominal values or stressed). Note that a component with no derating status indicates that either the derating properties of the component have not yet been updated or the component is not included in the derating standard.
), it displays the name of the derating standard that is applied to all the components under that item. For components, it shows the derating status (i.e., not stressed, exceeded nominal values or stressed). Note that a component with no derating status indicates that either the derating properties of the component have not yet been updated or the component is not included in the derating standard.
The Derating Status column may display any of the following icons to indicate the derating status of a component:
![]() Not Stressed. A green icon indicates that the component meets the requirements of the derating standard.
Not Stressed. A green icon indicates that the component meets the requirements of the derating standard.
![]() Exceeds Nominal. A blue icon indicates that the component does not meet the requirements of the derating standard, but it is not overstressed (i.e., is less than the worst case values).
Exceeds Nominal. A blue icon indicates that the component does not meet the requirements of the derating standard, but it is not overstressed (i.e., is less than the worst case values).
![]() Stressed. A red icon indicates that the component is overstressed according to the requirements of the derating standard.
Stressed. A red icon indicates that the component is overstressed according to the requirements of the derating standard.
In addition to the derating status indicators displayed in the system hierarchy, you can view the derating curves of a component by either double-clicking its derating status icon, or by selecting it and choosing Prediction Tools > Derating > View Component Derating.
![]()
The Component Derating window may include the following pages: Derating, Parametric Curve and Other Derating Criteria.
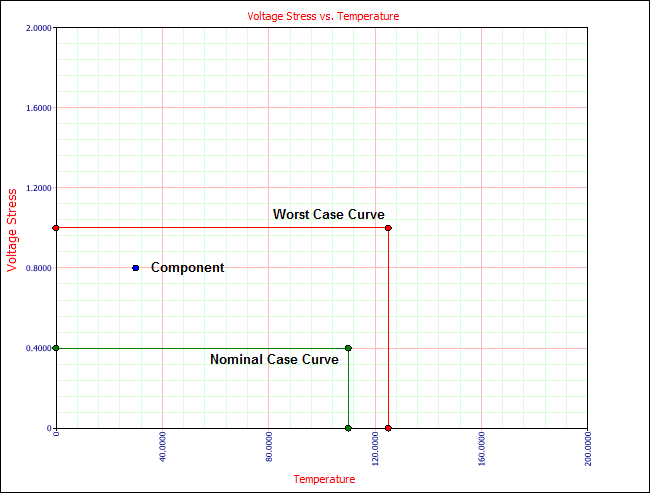
The Derating page displays a plot of the component's derating curves provided by the derating standard that you are working with. The nominal case curve is displayed in green and the worst case curve is displayed in red. The blue dot on the plot shows the component's working temperature and stress ratio. The location of the blue dot on the plot indicates the component's derating status:
If the blue dot is within the nominal curve, the component is not stressed.
If the blue dot is between the nominal and worst case curves, then the component exceeds nominal values, but is not overstressed.
If the blue dot is outside the worst case curve, the component is overstressed.
For example, the following plot shows a situation where the component exceeds the nominal values, but is not stressed.
The control panel shows the values used to create the nominal and worst case curves. This information is provided by the derating standard you are working with, based on the type of stress that is chosen in the Stress area in the control panel.
The color of the icon in the Stress area indicates the derating status of the component. It uses the same color indicators that are used in the Derating Status column in the system hierarchy (i.e., green means not stressed, blue means exceeds nominal and red means overstressed).
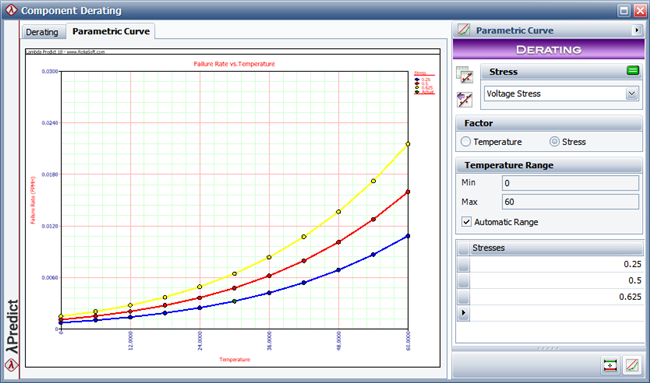
The Parametric Curve page is available only for MIL-217 and Bellcore/Telcordia components. It allows you to analyze the effects of stress and temperature on the component's failure rate. To use the plot:
Use the Stress area on the control panel to select which type of stress ratio to use in the plot. Different components will have different types of stress ratios available.
Use the Factor area to specify which factor to hold constant. This can be the temperature, or the stress ratio that was specified in the Stress area.
If desired, you can manually define the range of the plot axes by clearing the Automatic Range check box on the control panel and entering values in the Min and Max fields.
Finally, use the table to enter the value(s) for the selected factor.
The following example shows a plot for a particular component. In this example, the analyst wishes to evaluate how the failure rate of the component varies over increasing temperatures, based on a particular voltage stress ratio. The Stresses table on the control panel shows the component's actual voltage stress ratio (0.25) and two other voltage stress ratios that the analyst wishes to consider (0.5 and 0.625). This puts three curves on the plot, one for each voltage stress ratio, plotted against temperature (x-axis) and the component's failure rate (y-axis).
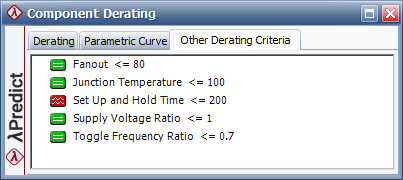
The Other Derating Criteria page provides information on other derating requirements that are not related to the temperature curves. This information is provided by the derating standard you are working with, and will be displayed only for applicable components. The color of the icon next to each criteria indicates whether the component meets that requirement. It uses the same color indicators that are used in the Derating Status column in the system hierarchy (i.e., green means not stressed, blue means exceeds nominal and red means overstressed).
The following example shows the derating requirements of one particular component. In this case, the "Set Up and Hold Time" property of the component exceeds the derating requirement, which is less than or equal to 200 minutes. Therefore, that criteria shows a red icon next to it, indicating that the component is overstressed.
© 1992-2019. HBM Prenscia Inc. ALL RIGHTS RESERVED.
| E-mail Link |