
In addition to the basic report templates that are included with Lambda Predict, you can create, manage and share your own custom report templates.
The report templates are saved as *.lp19r files and are always associated with a particular reliability prediction standard (e.g., a template created for the MIL-217 standard cannot be used to generate a report for a Telcordia analysis). To use the templates to generate or publish a report, see Lambda Predict Reports.
To create a new report template, choose Home > Templates > Report Templates.
![]()
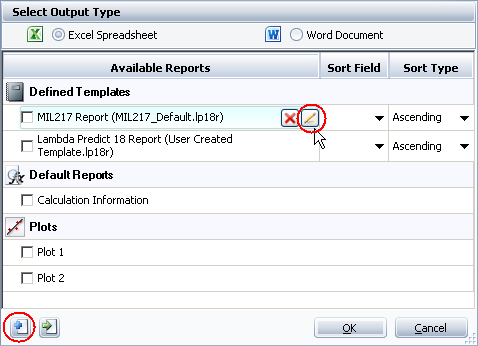
Alternatively, you can choose to create or edit a template during the
report generation/publishing process by clicking the Add
![]() or Edit
or Edit ![]() icon in the Select Report window, as shown
next.
icon in the Select Report window, as shown
next.
This opens the Report Template window, which contains the following commands:
![]() New
resets the interface so you can build a new template (*.lp19r). Note that
the file is not created until you save the template.
New
resets the interface so you can build a new template (*.lp19r). Note that
the file is not created until you save the template.
![]() Open
opens an existing *.lp19r file or files from previous versions of Lambda
Predict (*.lp18r, *.lp11r, *.lp10r or *.lp9r) for editing. Note that the
file does not get updated until you save the changes.
Open
opens an existing *.lp19r file or files from previous versions of Lambda
Predict (*.lp18r, *.lp11r, *.lp10r or *.lp9r) for editing. Note that the
file does not get updated until you save the changes.
![]() Save
saves the template so it can be used in the future for generating or publishing
any other reports. If you are editing a template from a previous version
of Lambda Predict (*.lp18r, *.lp11r, *.lp10r, *.lp9r), the template will
be saved in the *.lp19r format. By default, import templates are saved
in the default documents folder for your computer (e.g., My Documents\ReliaSoft\Lambda
Predict 19\Reports), but you can choose to save the file to any location
you desire.
Save
saves the template so it can be used in the future for generating or publishing
any other reports. If you are editing a template from a previous version
of Lambda Predict (*.lp18r, *.lp11r, *.lp10r, *.lp9r), the template will
be saved in the *.lp19r format. By default, import templates are saved
in the default documents folder for your computer (e.g., My Documents\ReliaSoft\Lambda
Predict 19\Reports), but you can choose to save the file to any location
you desire.
![]() Save As saves the existing
template using a different file name and/or to a different location.
Save As saves the existing
template using a different file name and/or to a different location.
Follow these steps to build or edit the template.
Click the Standard drop-down list to choose a reliability prediction standard. Your choice will determine which data fields are available to be included in the report. (If editing an existing template, you will not be able to change the selected prediction standard.)
Click the Data Range drop-down list and choose to include data from Blocks Only, Components Only, or from both Blocks and Components.
Build and organize the header and the body of the report by
moving the fields of interest from the Available
Fields area to the Selected
Fields area. The fields in the header area provide information
on the standard item or block for which the report is generated (i.e.,
the item that was selected when the Select Report window was opened).
The fields in the body area provide information on the sub-items of
that selected item, as specified in the Data Range drop-down list.
To move a field, you can:
Double-click the field
Click and drag the field to the desired location
Select it and then click the arrow buttons
To select multiple fields at once, hold the CTRL key while clicking all the fields you wish to move. To select multiple items that are adjacent, click the first field and then hold the SHIFT key while you click the last field. This will select all the fields between the first and last.
Customize the field headings, cell colors, header and/or footer as desired (see Formatting the Template). At any time, you can click the Preview tab to see how the report will look when it is generated.
(Optional) To add bar charts or pie charts to the report, click the Plot icon at the bottom of the control panel.
![]()
Click Save or Save As. The template file will be stored in the location you specify and will be accessible each time you generate a new report from this computer.
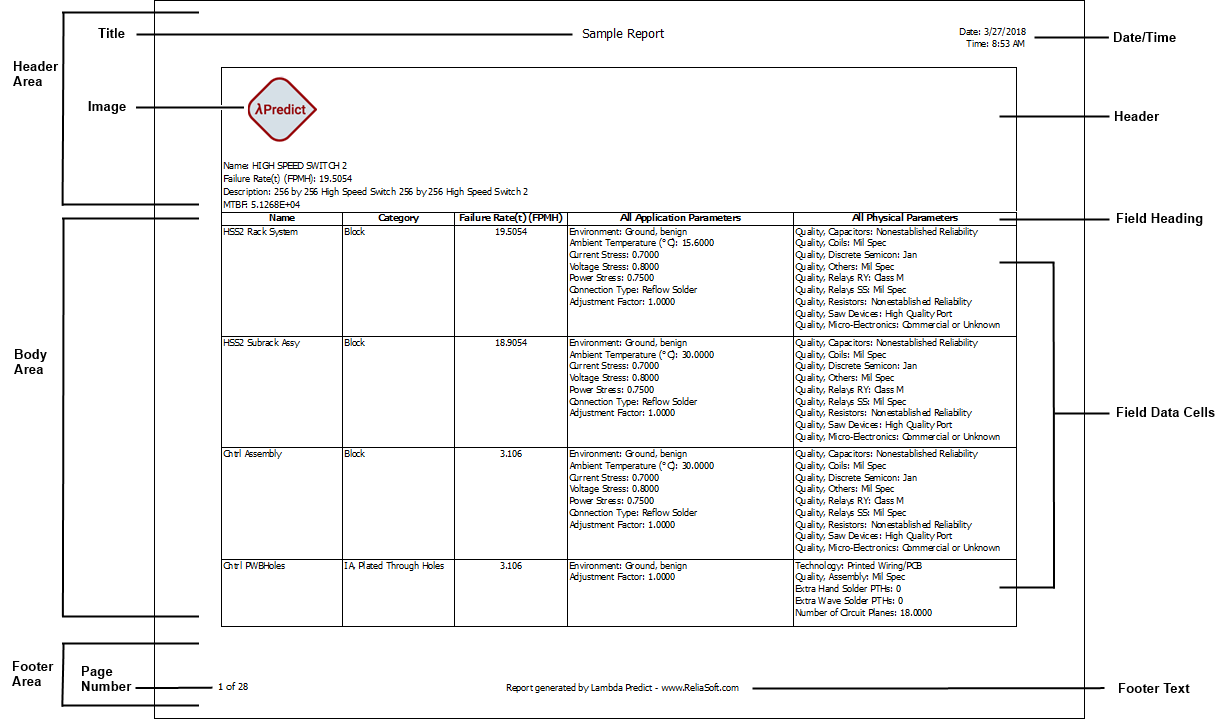
The following picture shows the parts of the report that can be customized:
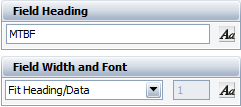
In the Body tab, select a field from the Selected Fields area. The selected field will appear in the Field Headings area of the control panel.
From here, you can:
Change the font style of the selected field by clicking the
Set Font icon ![]() icon in the Field
Heading area.
icon in the Field
Heading area.
Rename the selected field by typing over its name as it appears in the Field Heading area. The field’s new name will be displayed in the generated report.
Adjust the column width of the selected field by choosing one of the options in the Field Width and Font drop-down list. For example, if you choose the Fit Heading/Data option, the column width in the generated report will be adjusted automatically to have the same width as the heading or data, whichever is wider.
Change the font style of the data that will appear under the
selected field by clicking the Set
Font icon ![]() in
the Field Width and Font area.
in
the Field Width and Font area.
Tip: To select multiple fields and apply the same formatting all at once, hold down the CTRL key while clicking each field of interest, and then click the Set Font icons or the Field Width and Font drop-down list.
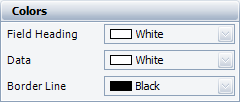
Click the Body tab, then on the control panel, use the Colors area to select the desired colors for the cells. You can change the colors for all field headings, data cells and border lines.
To add text and/or graphics that will be displayed at the top of the report in printouts, click the Header tab or click the icon on the control panel.
![]()
Similar to building the body of the report, add the data fields that you want to appear in the header by moving the fields of interest from the Available Fields area to the Selected Fields area.
Additional options are available on the control panel of the Header tab:
Report Title allows you to rename the report title and/or change the font.
Header Options sets the text alignment, font and background color of the header. You can specify whether to include the date/time the report was generated and whether to display the header on top of every page of the report.
Image allows you to add images, such as company logos, to the report. To use the Lambda Predict logo, click the Default button.
To add a footer that will be displayed at the bottom of the report in printouts, click the Footer icon on the control panel.
![]()
Enter the text you wish to display in the footer region of the report. To display page numbers in the report, select the Include page numbers check box.
© 1992-2019. HBM Prenscia Inc. ALL RIGHTS RESERVED.
| E-mail Link |