
| Related Topics: | ||
The data set used in this example is available in the example database installed with the software (called "doe9_examples.rsr9"). To access this database file, choose File > Help, click Open Examples Folder, then browse for the file in the DOE sub-folder.
The name of the example project is "Free Form Folio - Optimization."
In a previous example, data from a chemical engineering experiment was analyzed using the free form folio, with the goal of maximizing both response values. The results of the analysis are given in the "Historical Data" folio.
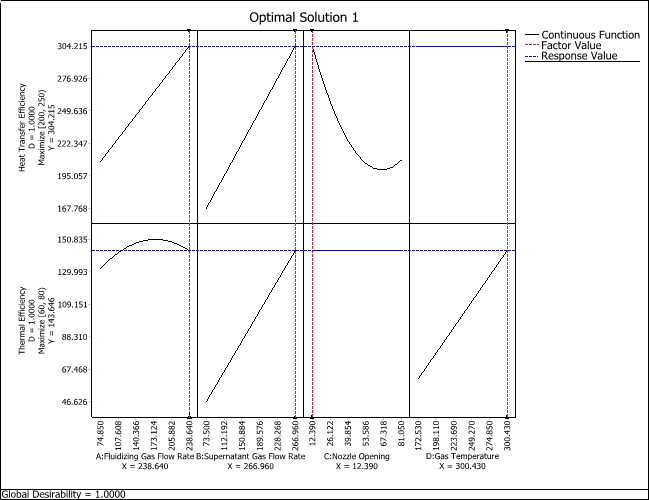
The next step is to find the best factor level combination using the models created in the free form folio. The “Optimal Solution Plot” in the example project provides a graphical analysis of the factor settings that will produce optimum values for the responses.
Click the Calculate icon to see the optimum settings for the responses. In this case, any values less than 60 for the heat transfer efficiency and less than 200 for the thermal efficiency are considered unacceptable. The Target values are the highest values that are expected given the process requirements.

The plot is shown next. You can see the optimal solution in a numeric format by clicking the View Solutions icon ( ![]() ) on the control panel.
) on the control panel.
The overlaid contour plots of these two responses are shown in the “Overlaid Contour Plot” folio. This folio shows the ranges of values for two factors (selected on the control panel) that produce the desired response values.
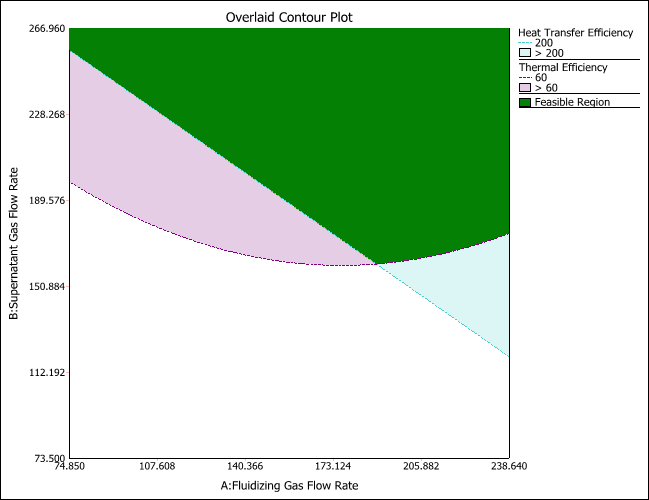
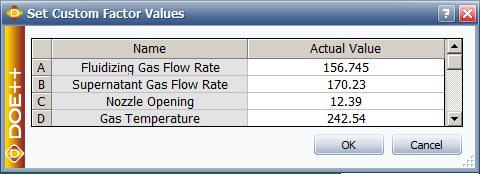
The green “feasible” area is the region where factors A and B produce the desired response values. In this example, factors C and D are fixed at custom values specified by clicking the Set link on the control panel.
Are there any other feasible regions if we vary the values of C and D, or if we only hold C constant but vary the value of D? The “Dynamic Overlaid Contour Plot” folio includes a tool that can help you answer this question.
The engineers decided to make factor C (nozzle opening) constant, but vary factor D (gas temperature) along with A (fluidizing gas flow rate) and B (supernatant gas flow rate). This is specified on the Factor Settings tab of the window that appears when you click the Calculate icon.

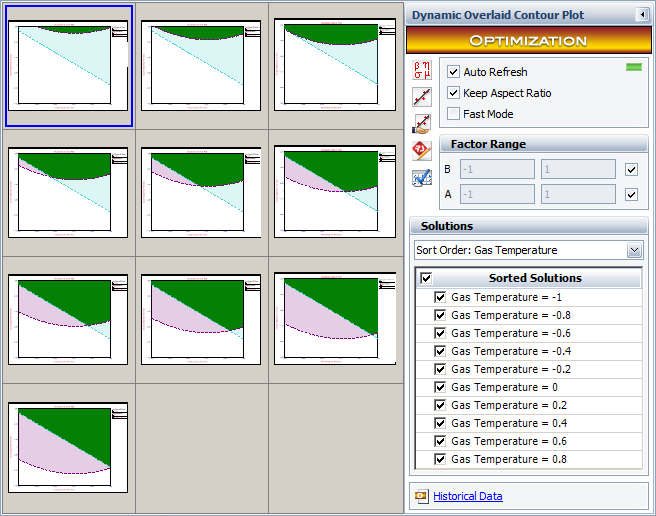
With these settings, the tool creates multiple overlaid contour plots where A and B are varied along the x- and y-axes. In each plot, C held constant at its lowest factor value. To vary D, ten plots are created, and each uses a different value for factor D. For example, the first plot uses D’s lowest value, and the last plot uses its highest value.
The plots are shown next, and each is identified in the Sorted Solutions area using the value for gas temperature that it uses. Double-click a plot to zoom in on it, and double-click it again to zoom out and view all the plots.
In this example, we obtained useful results from historical data. Different optimization tools in DOE++ were used to explore different factor level combinations. The easiest method is to use the optimal solution plot to quickly find the optimal solution. However, the overlaid contour plot can also be used to display the feasible region of two factors for multiple responses, while all other factors are held constant. And the dynamic overlaid plot can show the feasible region of two selected factors under different values for all other factors.
© 1992-2015. ReliaSoft Corporation. ALL RIGHTS RESERVED.