
The data set used in this example is available in the example database installed with the software (called "DOE10_examples.rsgz10"). To access this database file, choose File > Help, click Open Examples Folder, then browse for the file in the DOE sub-folder.
The name of the example project is "Gage R and R Study."
A gage R&R study was conducted using a crossed experiment, where each operator measures each part multiple times. The goal of the study is to determine whether the operators are using the gage in a consistent manner, and whether the gage itself is sufficiently precise. The data set is given in the "Gage R and R Crossed Design" folio. The product tolerance is 2,000 (i.e., the range of acceptable values for the product is 2,000). We want to evaluate the precision of this gage using the following three ratios:
The precision-to-tolerance ratio (or P/T ratio) is the variation due to the measuring system (i.e., the operators and the gage) divided by the product tolerance.
The gage-to-part variation ratio is the variation due to the measuring system divided by the variation in the parts themselves (i.e., part-to-part variation).
The gage-to-total variation ratio is the variation due to the measuring system divided by the total variation in measurements.
The data set for this example has been entered on the Data tab of the folio. There are 3 parts and 3 operators in the experiment. Each operator measured each part 3 times. The first 15 rows are shown next.
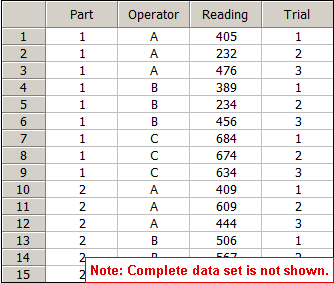
For example, you can see that Operator A measured Part 1 three times and measured Part 2 three times. Each measurement is shown in the Reading column.
On the Analysis Settings page of the control panel, the risk level and design type are specified. In addition, the operator * part interaction is selected to be included in the analysis, and the process tolerance specification is specified.
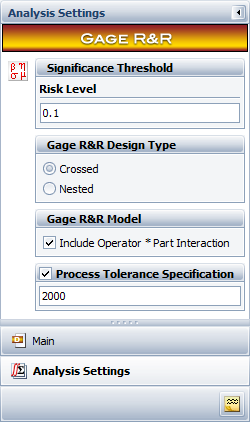
Click the Calculate icon to analyze the data.
![]()
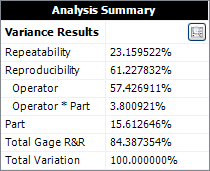
A summary of the results will appear on the Main page of the control panel. It shows a breakdown of the variance for different sources of measurement variation.
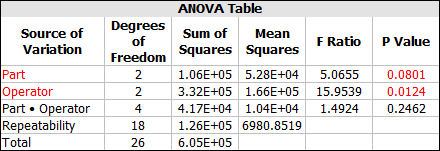
Click the View Analysis Summary icon to view the results in detail. The ANOVA table indicates that both the part and operator have a significant influence on the measurement variation.
The P/T ratio in the Gage Variance Results table is in the last column in the Total Gage R&R row. The calculated value is 47.85%, which is much higher than the recommended 10% maximum.
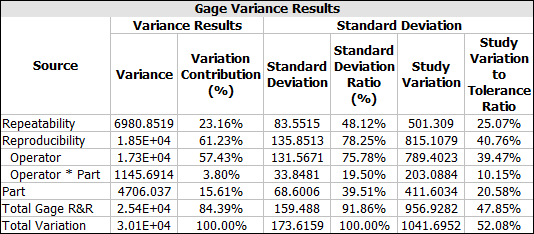
The gage-to-part variation ratio is the standard deviation for the Total Gage R&R (i.e., total variation due to the measurement system) divided by the standard deviation for the Part (i.e., part-to-part variation).
159.488/68.6006 = 232.49%
The gage-to-total-variation-ratio is the standard deviation for Total Gage R&R divided by the standard deviation for Total Variation.
159.488/173.6159 = 91.86%
Clearly, all these ratios are too large. As a result, the experiments concluded that the operators should be trained so they perform measurements more consistently, and a better gage may need to be used.
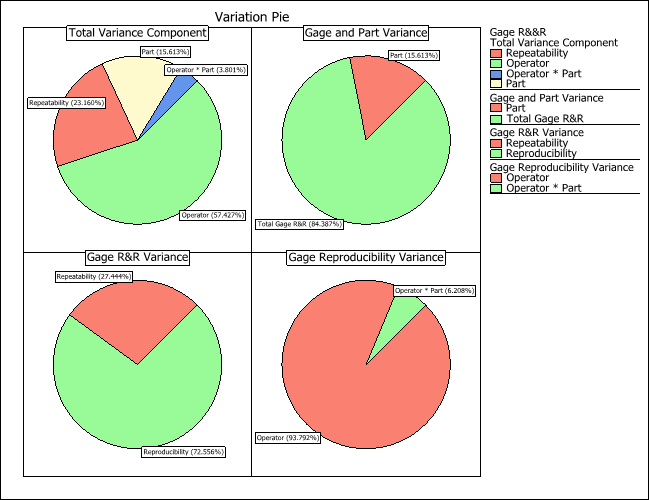
To further examine the breakdown of difference sources of measurement variation, click the Plot icon and view the variation pie charts to see the contribution of each variance component. The charts are shown next.
© 1992-2016. ReliaSoft Corporation. ALL RIGHTS RESERVED.
 |
E-mail Link |