
Starting in Version 9, simulation worksheets allow you to vary values that are used when simulating a BlockSim RBD or a RENO flowchart. This allows you to investigate the effect of one or more settings on the simulation results.
Simulation worksheets consist of columns that can be defined as inputs or outputs. The input values are used during simulation, and they can be entered manually or transferred from a DOE++ experiment design. Values in output columns are determined through simulation. For example, you might design an experiment in DOE++ and transfer all the factor level combinations to the simulation worksheet. Then you could simulate the experiment in BlockSim and transfer the output values back to DOE++ to analyze the results. If, on the other hand, you do not want to test all combinations of all factor settings, you can enter the desired combinations of settings by hand.
In general, using a simulation worksheet will include the following steps:
Depending on what you are trying to achieve, some of the steps may not be necessary.
In this topic, we will consider an example in which we explore options for maintaining a spare part pool, with a goal of maximizing system availability while minimizing the cost of the pool. The factors that we will vary are the number of spare parts initially in the pool, the frequency with which the pool is restocked and the number of parts added to the pool at each restock.
Build the diagram for the system in BlockSim/RENO. Use variables to represent the factors whose settings you want to investigate. Depending on the factors you are studying, you might use the variables directly (as field inputs for BlockSim blocks and resources, or in equations and functions in RENO) or via a dynamic model. In BlockSim diagrams, the following fields can be defined using a variable:
In standard blocks:
Throughput
In crews:
Number of tasks (visible when there is a limit to the number of tasks the crew can perform at the same time)
In spare part pools:
Initial stock level
Capacity if Pool has maximum capacity is selected
For scheduled restocks:
Restock every
Number added per restock
For restocking as needed:
Restock when stock drops to
Number added per restock
For emergency spare provisions:
Number added per emergency
Interval value
Any field that takes a model can use a dynamic model; it is up to you to decide if exploring various values for that field will yield useful results.
IMPORTANT: In RENO flowcharts, you will need to store the results of interest in variables. The When to Reset field for output variables must be set to Never Reset in order for the results to be available to the simulation worksheet. This ensures that the results are available to the simulation worksheet, rather than the variables being reset to their initial values.
Example:
The spare part pool that is used by the tasks in our example is configured as follows:
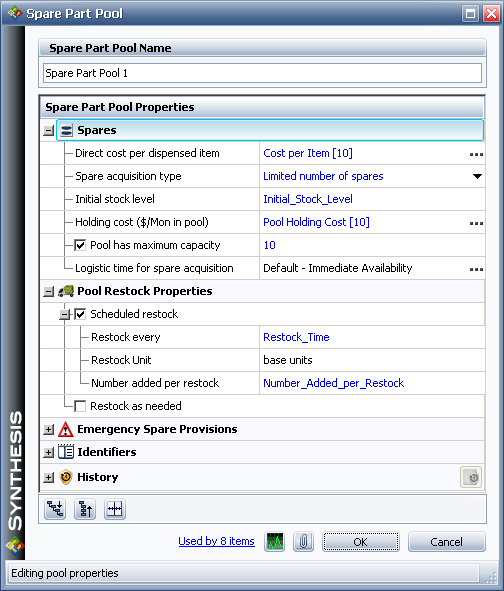
The cost per item is specified as a constant model equal to $10 and the holding cost is specified as a constant model equal to $10 per month. Since the factors of interest (i.e., the initial stock level, the frequency of restocking and the number added per restock) will not be held constant, they are assigned to variables. These variables represent factor values that will be specified in the simulation worksheet.
For the factors of interest, you will decide on the settings to be used in simulation and the combinations of factor settings that should be tried (i.e., that will be used as inputs to the simulation).
One way to do this is to build an experiment design in DOE++ and then transfer the factor settings to a new simulation worksheet by choosing Data > Simulation Worksheets > Transfer to Simulation Worksheet.
![]()
This will ensure that the factor settings are tested in combinations appropriate to determine the effects of each factor and of factorial interactions.
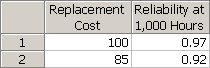
In some situations, not all factor setting combinations may be possible. For instance, let's say that you are considering two versions of a part, one that costs $100 and has a reliability of 0.97 at 1,000 hours and another that costs $85 and has a reliability of 0.92 at 1,000 hours. You can vary the cost of replacement and the block reliability to account for these scenarios. You would not, however, want to run a simulation using a cost of $85 and a reliability of 0.97, since that combination does not reflect an available part. In cases like this, you can add a new simulation worksheet to the project by choosing Insert > Simulation Worksheets > Add Simulation Worksheet.
![]()
After adding the new worksheet, you can enter the desired factor values manually, as shown next. (Note that the column names were changed by double-clicking each column header.)
While you have the simulation worksheet open, it will be read-only in other applications. For instance, if you create the simulation worksheet in DOE++, it will be read-only in BlockSim and RENO until you do one of the following:
Close the simulation worksheet, or
Click Commit and Lock on the control panel. This will commit the data in the simulation worksheet to the database and lock the simulation worksheet within the current application so that it will be available within other applications.
In either case, if you already have the simulation worksheet open in a read-only state, you will need to click Unlock and Edit on the control panel once you have released the lock in the original application.
Example:
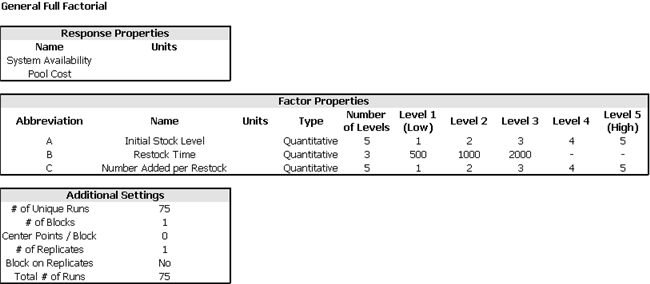
The DOE++ experiment used in our example is a general full factorial design using the following settings:
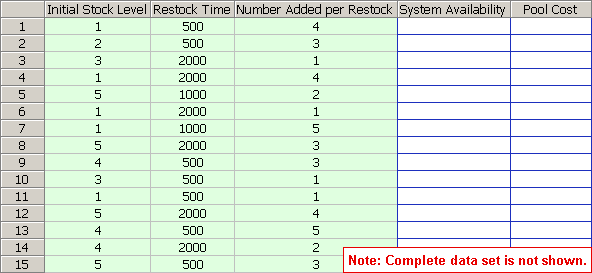
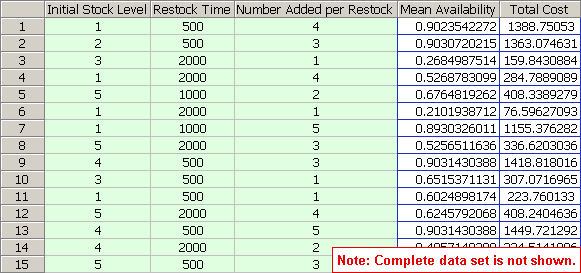
The first fifteen rows of the simulation worksheet that is created in the transfer process are shown next.
Once the factor settings have been entered in the simulation worksheet, you will simulate the worksheet in BlockSim/RENO. The software will perform a set of simulations for each combination of factor settings in order to obtain response values. In BlockSim/RENO, open the simulation worksheet and click the Simulate icon on the control panel.
![]()
The Select Diagram window will appear, allowing you to select the diagram that will be used to simulate the response values (i.e., the data source) for the simulation worksheet.
Note: You can also click the Associated Data Sources icon to specify or change the source diagram.
The Worksheet Simulation window then appears, allowing you to specify the information contained in each column of the simulation worksheet.
In the Source of Variable Inputs area, assign the variables representing the factors of interest to the appropriate input columns in the worksheet. Available variables will be shown in the drop-down list for each column. If a factor of interest is represented by a dynamic model, choose the variable upon which the dynamic model is based.
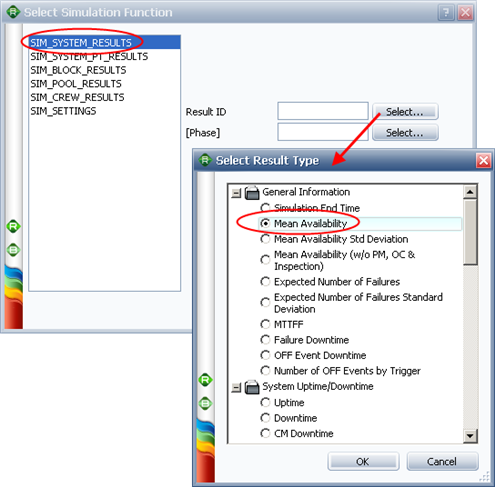
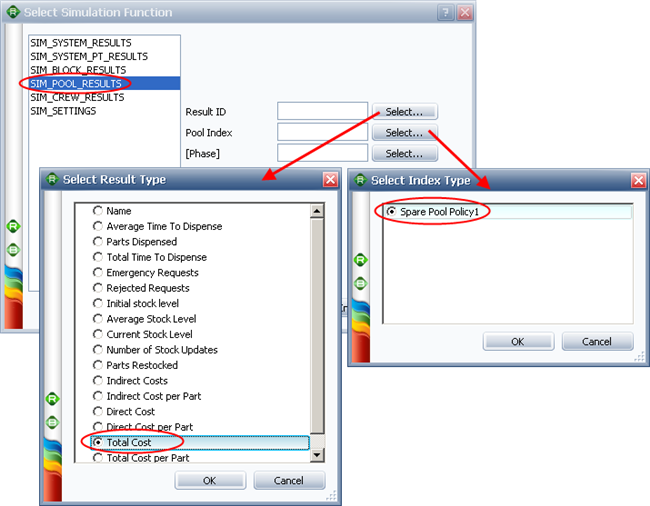
In the Simulation Output area, for each result column, specify the result to be entered:
If the associated diagram is a BlockSim simulation RBD, define the function to calculate from each simulation. This is done by clicking the cell associated with the result column to open a limited version of the Function Wizard, where only the simulation functions are available.
If the associated diagram is a RENO flowchart, select the variable to read for the result.
Example:
The Worksheet Simulation window used in our example is shown next.
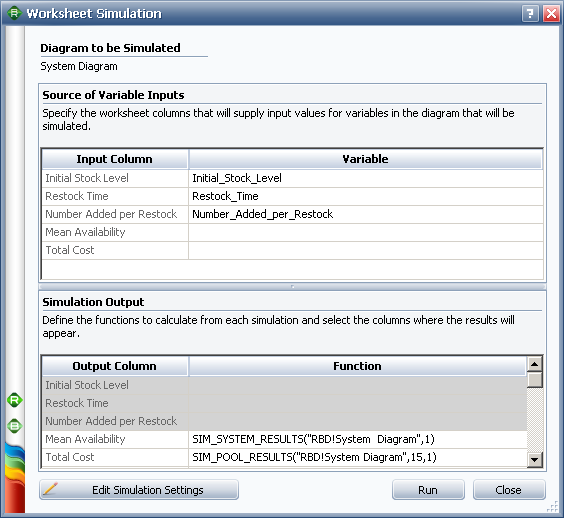
The result columns were specified as follows:
With all columns defined, you can perform the simulation in BlockSim/RENO.
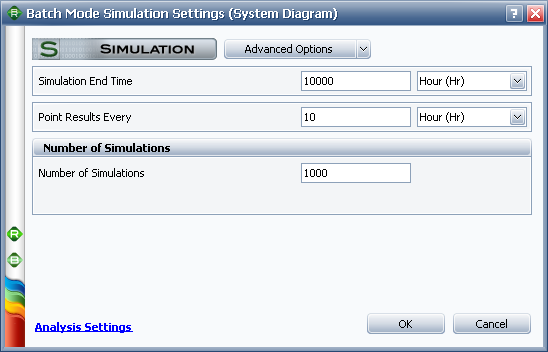
Click the Edit Simulation Settings button to open the Batch Mode Simulation Settings window. This is an abbreviated version of BlockSim's Maintainability/Availability Simulation window or of the RENO simulation window, depending on whether the associated diagram is a simulation RBD or a RENO flowchart. The settings that you specify will apply to the simulation performed for each row (i.e., each factor setting combination). Specify the desired simulation settings and click OK to return to the Worksheet Simulation window.
Click Run to perform the simulations. The results will be entered in the simulation worksheet.
Commit and lock the simulation worksheet to make it available for analysis in DOE++.
Example:
The simulation settings used in our example are shown next.
The first fifteen rows of the simulation worksheet, with results, are shown next.
The results that were derived from the simulation can now be analyzed in DOE++. To do this:
Open the simulation worksheet in DOE++. (If it was already open, click the Refresh icon on the control panel to load the results and unlock the simulation worksheet for use in DOE++.)
Transfer the results to a design folio for analysis. You can do either of the following:
Click the Transfer to Standard Design Folio icon on the control panel to transfer the defined input and output columns to the factor and response columns in an existing standard design folio.
![]()
In the window that appears, select the design folio to transfer to and match up the columns in the design folio (factor/response columns) with the columns in the simulation worksheet (input/output columns), as shown next.
![]()
Note that all data will be transferred from the simulation worksheet, so if you have made changes to the input/factor columns in the simulation worksheet, those changes will be transferred to the design folio.
Click the Transfer to Free Form Folio icon on the control panel to transfer the defined input and results columns to a new free form folio.
![]()
You can then perform any analysis you choose in DOE++, including optimization.
Example:
The results of optimization in DOE++ for our example are shown next.
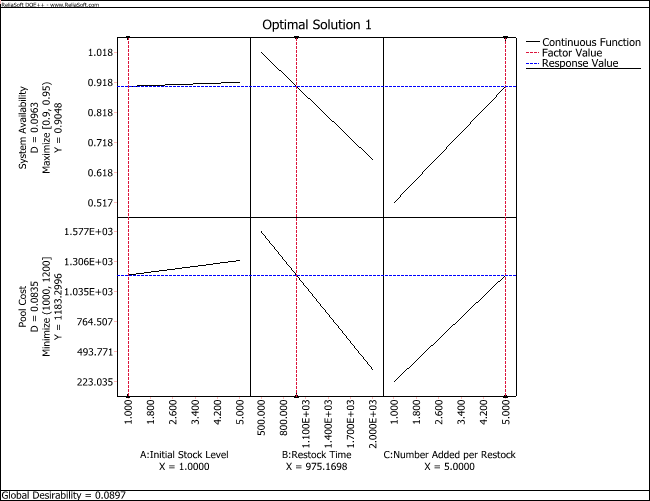
A single optimal solution is found with Initial Stock Level = 1, Restock Time = 975.1698 and Number Added per Restock = 5. This gives a system availability of .9048 and pool cost of 1183.30.
Because BlockSim/RENO and DOE++ rely on different methodologies to arrive at results, predictions made by DOE++ will vary from the simulated results generated by BlockSim/RENO. Therefore, the optimal settings selected by DOE++ must be simulated in BlockSim/RENO to ensure that the predicted results are reliable. To do this, return to BlockSim/RENO and, for each of the variables, set its initial value to the value given in the optimal solution and then simulate the diagram directly (i.e., not via the simulation worksheet) to make sure that the results are close to those estimated in DOE++.
Example:
The simulation results from BlockSim are shown next.
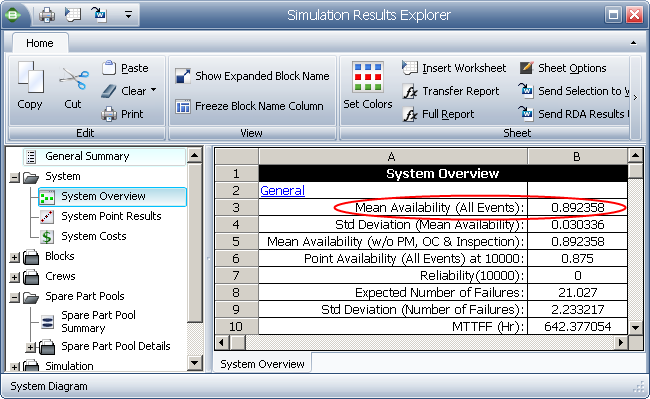
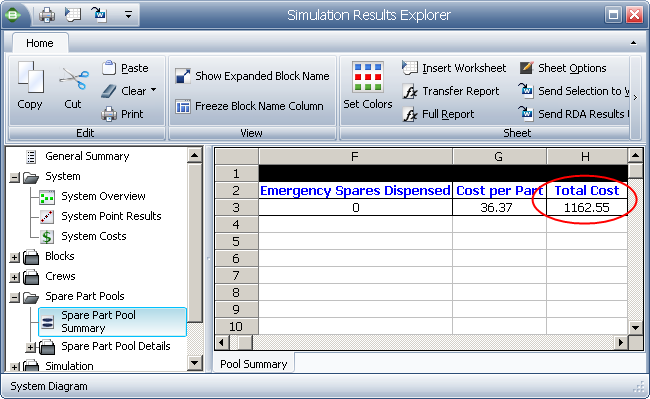
The results show a mean system availability of 0.8924 and a total cost for the pool of $1162.55. These values are very close to the estimated values in DOE++.
© 1992-2015. ReliaSoft Corporation. ALL RIGHTS RESERVED.