
| Related Topics: | ||

A RENO simulation definition enables you to trigger simulation of a BlockSim diagram from within a RENO flowchart by using certain RENO internal functions, so that you can use one or more results from the simulation in the flowchart.
Note: You can access BlockSim analytical diagrams for use in RENO flowcharts by using the analytical diagram's published model.
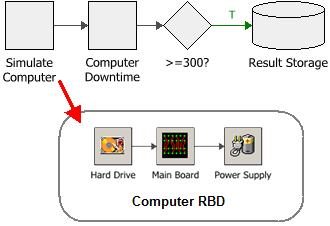
The following example shows a scenario where an RBD of a computer is simulated by the block called "Simulate Computer." The resulting system downtime is retrieved by the block called "Computer Downtime" and evaluated by the conditional block. If the downtime is greater than or equal to 300 hours over the 10,000 hour simulation period, then the computer is deemed to have insufficient availability.
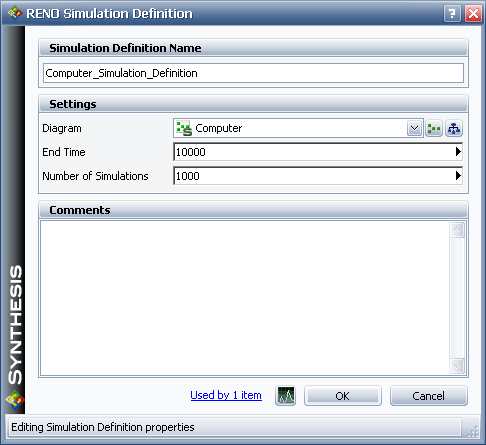
The following picture shows the simulation definition that is used to simulate the "Computer" RBD. This performs a run of 1,000 simulations of the RBD called "Computer," each simulation for a period of 10,000 hours.
The "Simulate Computer" block uses this simulation definition as the parameter for the RENO internal function called "simulate," as shown next.

The "Computer Downtime" block can then retrieve the downtime for the "Computer" RBD by using the same simulation definition as the parameter for the RENO internal function called "sr_downtime," as shown next.

The value retrieved is then passed to the conditional block for evaluation.
Another way to use a simulation definition is demonstrated next, using the same simulation definition as in the example above.
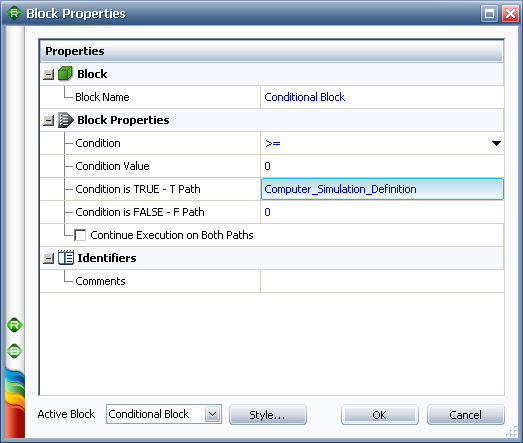
This conditional block checks the incoming value to determine if it is greater than 0. If it is, then the "Computer" RBD is simulated 1,000 times, each for a period of 10,000 hours, as specified by the simulation definition. The resulting mean availability value for the system is then passed along the outgoing "true" path.
The BlockSim diagram called by the simulation definition can be either a simulation RBD or a simulation fault tree. If the desired diagram does not exist, you can use the icons beside the Diagram field to create it.
For the End Time and Number of Simulations fields, the expression can include:
Numerical values
Predefined mathematical functions (exp, log, sin, etc.)
References to any analysis workbooks
You can enter the equation manually, or you can use the function selector or the equation editor to assist you.
RENO resources, analysis workbooks and internal functions are automatically color-coded to assist in reading the equation. When the cursor is positioned on one of these items, a preview area appears and displays a summary of the item. If the item is a resource, you can click the View icon in the Preview area to open that resource's properties window.
![]()
IMPORTANT: All values and results are assumed to be in terms of the default unit specified for the database. See Using Time Units in RENO for details on how this may affect your analysis.
Note that the seed used in the simulation is taken from the current RENO simulation and a single thread is always used.
© 1992-2015. ReliaSoft Corporation. ALL RIGHTS RESERVED.