RENO flowcharts are used to build models of probabilistic or deterministic problems, processes or scenarios in order to help you understand and/or quantify them. The flowchart is a graphical representation of the mathematical process of predicting an outcome.
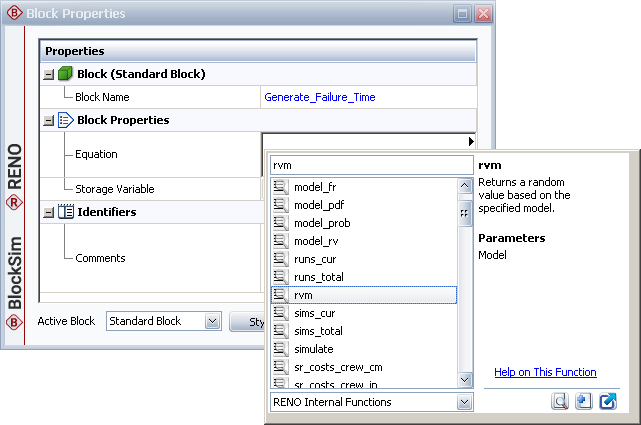
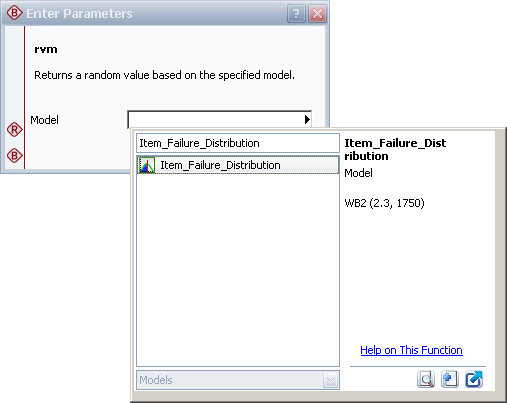
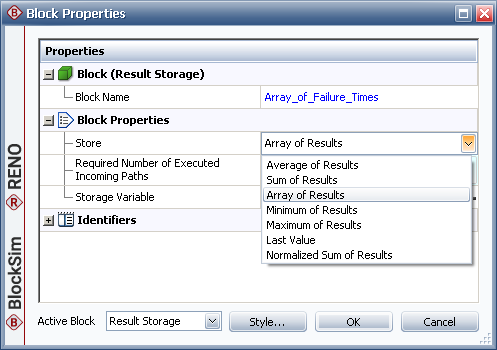
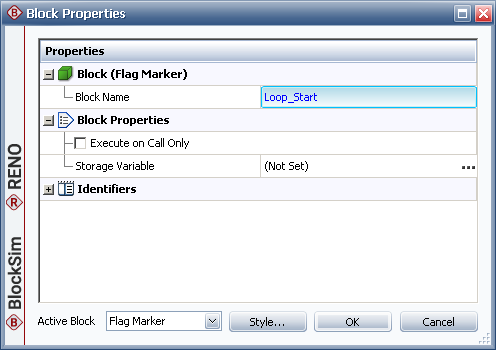
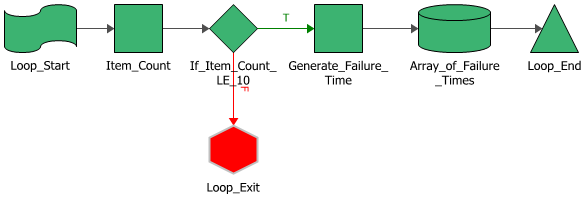
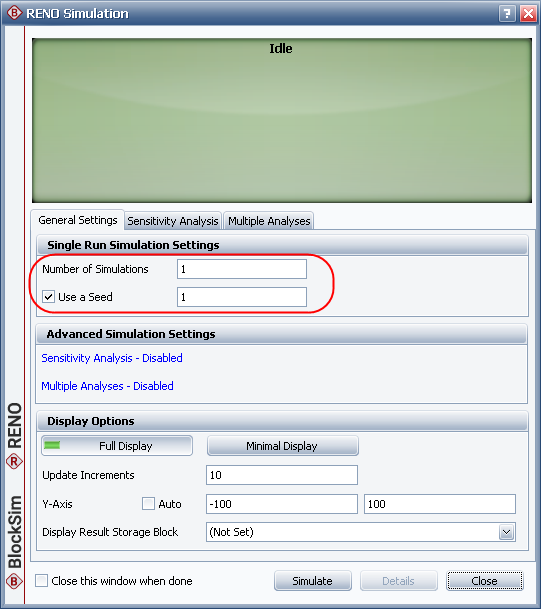
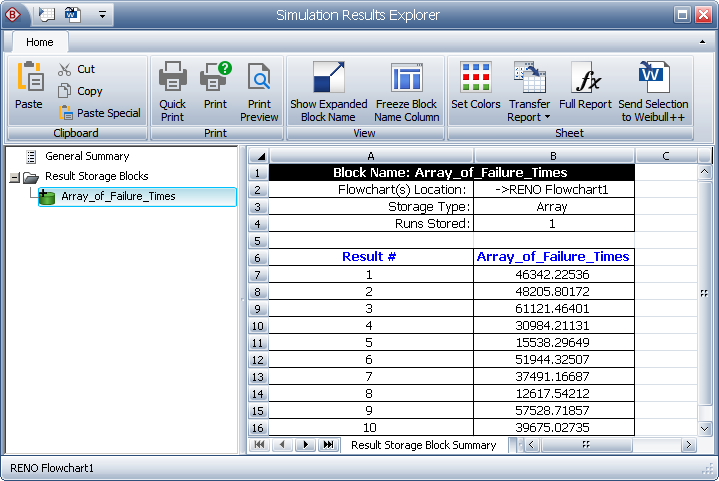
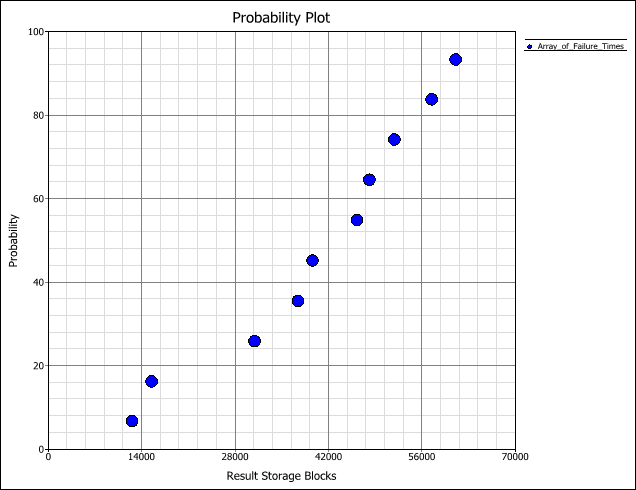
The example that follows demonstrates some of the basic techniques used in working with RENO flowcharts. This simple flowchart generates failure times for 10 items.
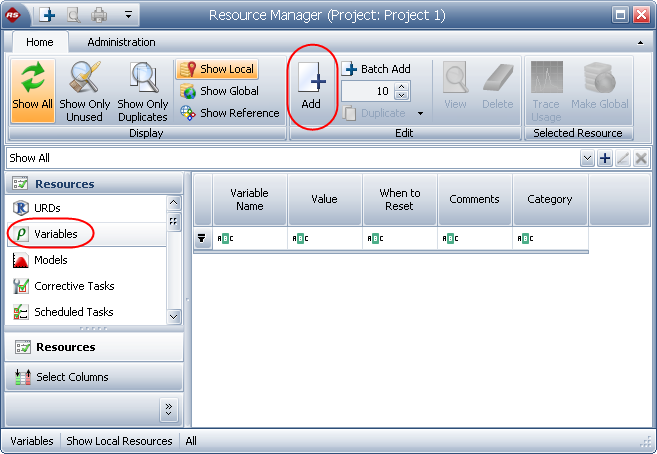
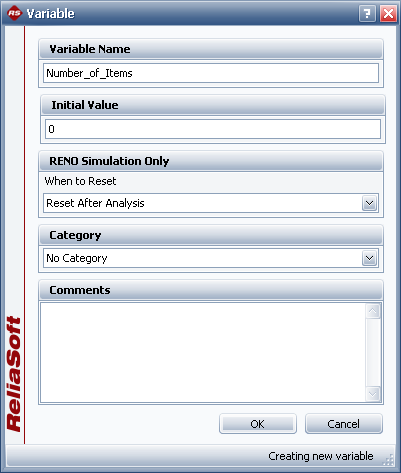
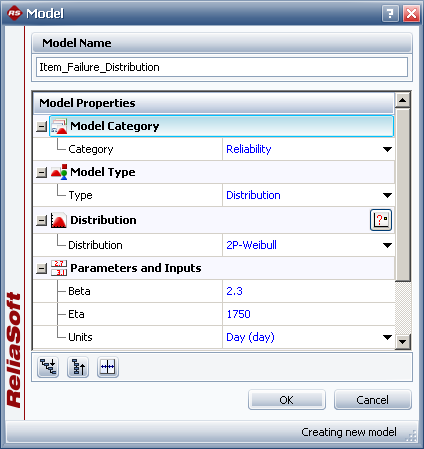
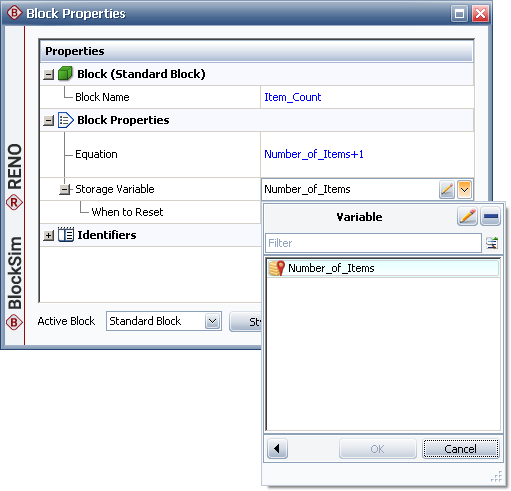
Define resources
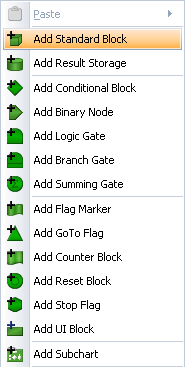
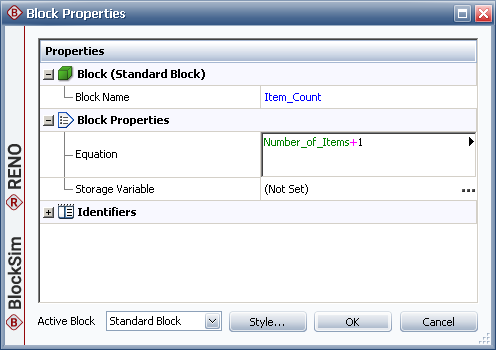
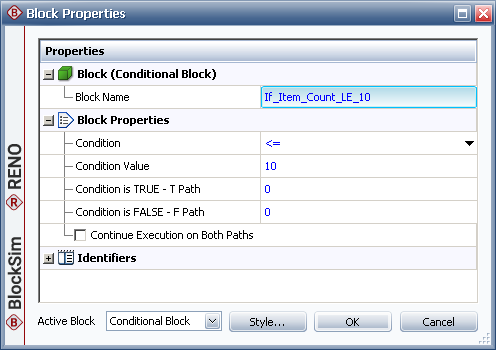
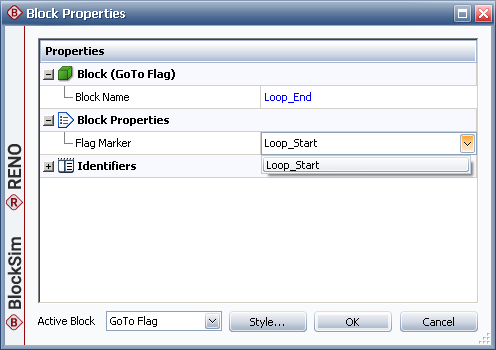
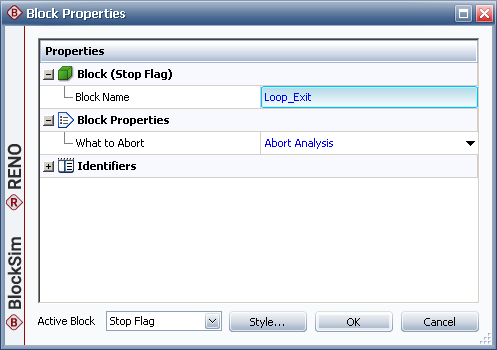
Add blocks (See Flowchart Block Types.)
| Quick Tour |
| Tour Intro - Repositories & Projects - Fault Trees - Simulation RBDs - RENO Flowcharts - More Analyses & Tools |
© 1992-2019. HBM Prenscia Inc. ALL RIGHTS RESERVED.
| E-mail Link |

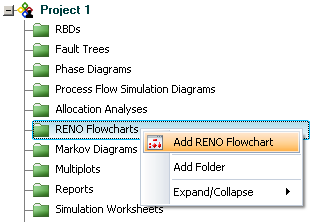
 Add diagram