

The area at the top of the Maintainability/Availability Simulation window displays the status of the simulation.
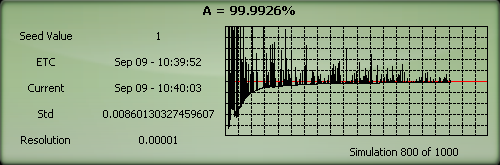
The following numerical information is always shown:
Seed Value displays the seed value used or, for log of simulations, the starting seed value.
ETC displays the expected date and time of completion for the simulation.
Current displays the current date and time during the simulation. Once all simulations have been performed, this value will display the actual time of completion.
In addition, the current mean availability is shown at the top of the simulation status display. The current number of simulations performed out of the total number of simulations scheduled to be performed (or, in the case of a variable number of simulations, the maximum number of simulations) is shown at the bottom of the simulation status display (e.g., 10 out of 100 simulations).
If you have selected Full Display in the Display Options drop-down, a plot will also be shown in the simulation status display. This plot shows, for each simulation, the difference between the previous mean availability and the current mean availability, as a percentage of the current mean availability. For example, consider the following table:
|
Current Simulation |
Availability in Current Simulation |
Mean Availability Through Current Simulation |
Value Shown in Simulation Convergence Plot |
|
1 |
0.8 |
0.8 |
- |
|
2 |
0.9 |
0.85 |
0.059 |
|
3 |
0.8 |
0.833 |
-0.02 |
|
4 |
1 |
0.875 |
0.048 |
|
5 |
0.8 |
0.86 |
-0.017 |
|
6 |
0.6 |
0.817 |
-0.053 |
|
7 |
0.7 |
0.8 |
-0.021 |
|
8 |
0.9 |
0.813 |
0.015 |
|
9 |
1 |
0.833 |
0.025 |
|
10 |
0.7 |
0.82 |
-0.016 |
To understand how these values are obtained, we can look at simulation 3 as an example. The mean availability at the end of simulation 3 is the average of the availability in simulation 1, simulation 2 and simulation 3, or (0.8 + 0.9 + 0.8) / 3 = 0.833. The value shown in the convergence plot is obtained by subtracting the previous mean availability from the current mean availability and then dividing that number by the current mean availability: (0.833 - 0.850) / 0.833. In this case, this yields a negative value, because the current mean availability is less than the previous mean availability.
The table above would result in the following convergence plot:
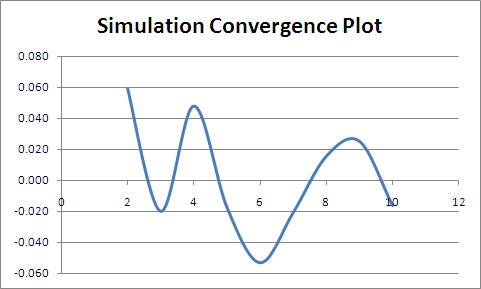
As additional simulations are performed, the general pattern is that the mean availability values start to converge, and the line in the convergence plot stabilizes to a straight line. After this point, additional simulations are not especially beneficial.
You can use the Resolution field in the Display Options drop-down to specify the scaling of the convergence plot. The larger the number, the greater the range of values shown on the y-axis of the plot. The Update Increments field specifies how many times the label below the plot, reflecting the current number of simulations performed out of the total number of simulations, will be updated during the simulation process.
The following additional information is also displayed when Full Display is selected:
Std shows the current value in the convergence plot (i.e., the value obtained by subtracting the previous mean availability from the current mean availability and then dividing that number by the current mean availability).
Resolution shows your choice for the scaling of the plot.
© 1992-2019. HBM Prenscia Inc. ALL RIGHTS RESERVED.
| E-mail Link |