
New in Version 11, the fault tree tracer provides a way to visualize how fault tree subdiagrams fit into a parent fault tree. This may be helpful if, for example, your team works on an assembly represented by a particular fault tree, and you need to know how it relates to the overall system.
Note: This tool is exclusively for use with fault trees. Any RBDs used as subdiagrams within the parent fault tree will not be available for selection as subdiagrams of interest, and will not be available for expansion within the tracer report.
To create a fault tree tracer, choose Insert > Reports and Plots > Fault Tree Tracer.
![]()
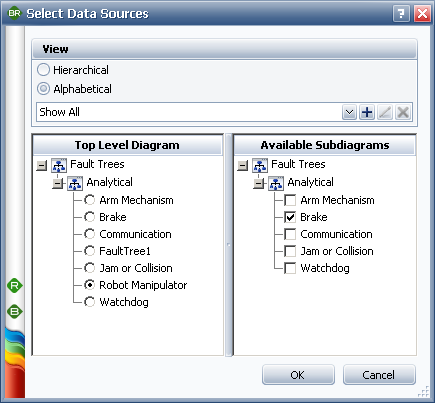
In the Select Data Sources window, first select a parent fault tree from the Top Level Diagram list. The Available Subdiagrams list will then show all of the fault tree subdiagrams referenced by the top level diagram or any of its subdiagrams. Select the subdiagram(s) that you are interested in and click OK to create the report.
Hierarchical arranges the lists as they are shown in the current project explorer.
Alphabetical sorts them alphabetically.
If you apply an item filter, only fault trees that fit the criteria will be shown in the Top Level Diagram list.
Tip: Depending on the size of the diagrams you're working with, this can be a memory-intensive process. On the Calculations page of the Application Setup, you can set the maximum number of blocks to read and maximum percentage of memory to be consumed by the fault tree tracer. If the process exceeds the values specified for these options, a partial tracer will be shown, with an annotation indicating the limit that has been exceeded.
If any of the diagrams within the tracer has changed since the report was created, the status light in the control panel will be red. To update the tracer with the most current information, choose Tracer > Data Source > Refresh or click the icon on the control panel.
![]()
If you later need to change the top level diagram and/or the subdiagram(s) of interest, choose Tracer > Data Source > Select Data Sources or click the icon on the control panel.
![]()
The Diagram panel at the bottom of the report shows thumbnails of the tracer reports for the top level diagram and each subdiagram of interest. Use this panel to select which diagram will be displayed at full size in the tracer report.
To open any of the fault tree diagrams, double-click the subdiagram block or click the link in the control panel.
By default, each tracer diagram shows only the subdiagrams of interest (displayed as subdiagram blocks) and their direct paths to the top gate of the parent fault tree. The lowest level tracer subdiagram(s) (i.e., those that do not contain any subdiagrams of interest) will show all blocks they contain. Use the check boxes in the control panel to change what is shown.
Show Parent Diagram Names: Shows the name of the diagram where each block is located (displayed at the upper right of each block). You can change the appearance of the text via the relevant Block Corner Indicators page of the Diagram Style window.
Auto Refresh: Automatically rebuilds the fault tree tracer when either of the two options below is selected or cleared. If this option is not selected, click the Refresh icon to rebuild.
Expand Subdiagrams: Shows all blocks in the direct paths within all subdiagrams.
Show Blocks Outside of Path: Includes any blocks that are not found in the path between the top gate and the subdiagram(s) of interest.
Choose Tracer > Selection > Trace Path of Interest or click the button on the control panel to select all subdiagrams of interest and highlight the paths from them to the top gate of the parent fault tree.
![]()
For example, let's say that you are interested in the potential failure of a brake mechanism within a system. You create a fault tree tracer:
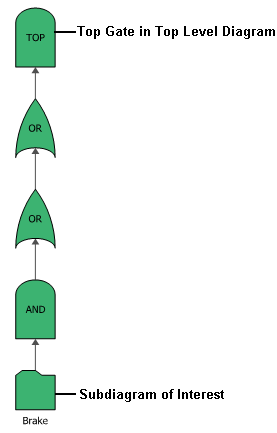
Initially, the tracer shows just the direct path between the subdiagram of interest (Brake) and the top of the top level diagram (Robot Manipulator).
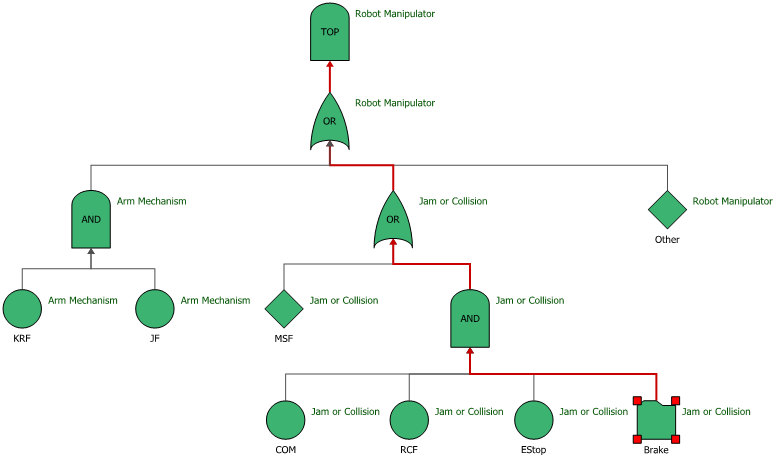
If you select the Show Blocks Outside of Path and Show Parent Diagram Names options on the control panel and click Trace Path of Interest, the tracer looks like this.
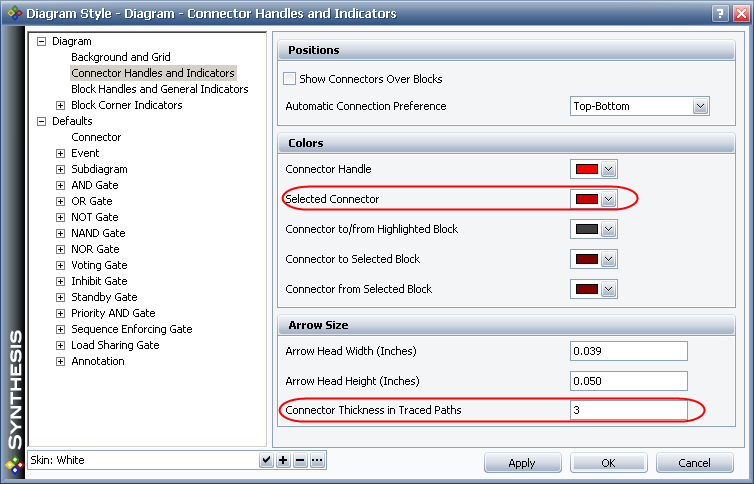
The appearance of the traced path can be modified in the Diagram Style window.
© 1992-2017. HBM Prenscia Inc. ALL RIGHTS RESERVED.
 |
E-mail Link |